
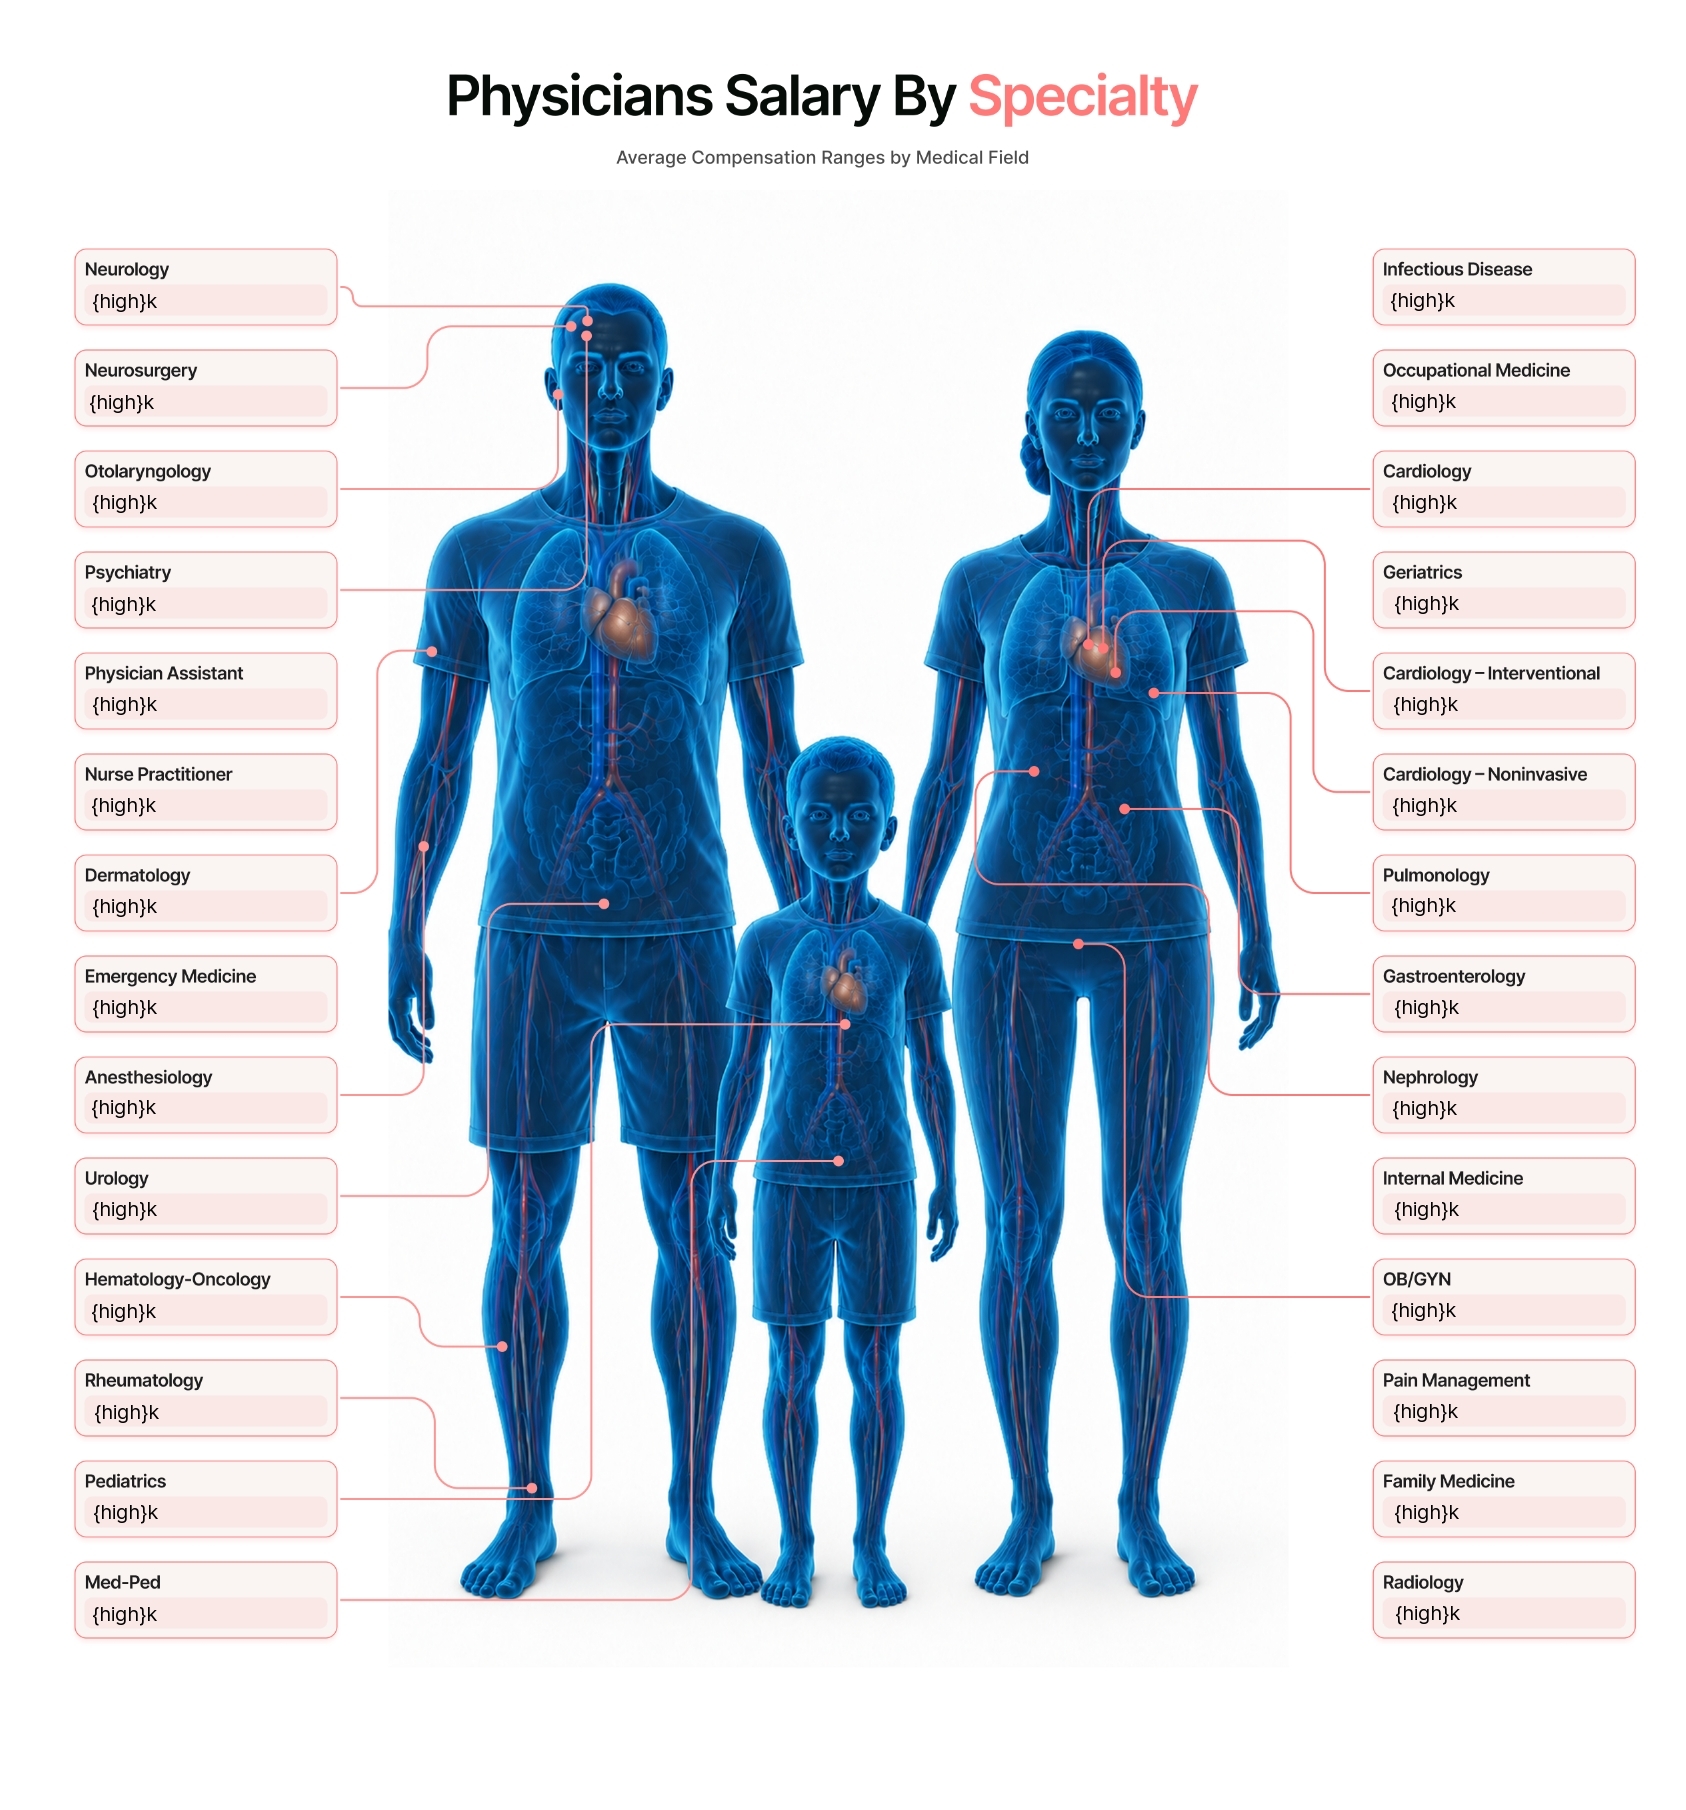
The PhysEmp Salary Report: July 2026 — A Cross‑Specialty Market Overview
The single most interesting signal in July’s dataset is geographic inversion: in dozens of specialties the highest disclosed pay is coming from low‑volume, noncoastal markets while the largest listing pools — New York, California, Florida, Texas — either underpay or refuse to publish numbers. From Cardiology to Hospitalist work, the market is paying cash where people won’t move and staying quiet where candidates already live.
Across 37 specialty reports this month the themes are consistent: wide ranges inside specialties, persistent opacity from employers, and a clear premium for scope or scarcity. Read the line items below as a map: the coasts offer choice; the flyover states are where the money is.
Primary Care & General
Primary care and general medicine remain a study in scale plus compression. Family Medicine (Family Medicine) shows 2,957 listings with 755 salary disclosures and a national band roughly $175k–$465k (practical mid ≈ $270k–$310k). Internal Medicine (Internal Medicine) posts 1,523 listings, 470 disclosures, range $125k–$650k with a practical cluster around $240k–$360k. Hospitalist (Hospitalist) demand is deep (543 listings) but only 69 disclosed salaries; full range $210k–$600k and a national average band near $318k–$345k.
Smaller generalist niches show the same map‑vs‑money split. Med‑Peds (Med‑Ped) has a $200k–$400k spread but only 17 disclosures; Geriatrics (Geriatrics) shows a $200k–$325k band from just 6 disclosures. The Primary Care Physician report (Primary Care) is notable for its higher transparency (104 of 146 listings) and a $220k–$410k range — but the Sunnyvale outlier is driving the ceiling.
Bottom line: primary care pays a reliable middle; extreme top dollars are delivered by targeted rural or leadership plays, not by market saturation. Transparency helps: the specialties with higher disclosure rates make it easier for candidates to shop and for recruiters to convert.
Medical Specialties
This is the widest group and also the most telling about what the market values. Procedural scope and leadership continue to lift ceilings: Anesthesiology (Anesthesia) lists a national band $250k–$1,000k (national cluster $400k–$600k), Cardiology in its forms is theatrical — Interventional (Interventional) disclosed up to $990k (avg ≈ $692k–$774k from 15 disclosures), Noninvasive (Noninvasive) shows a $300k–$1,000k spread from 12 disclosures, and General Cardiology (Cardiology) overall reports $300k–$835k with 56 disclosures.
Other medical specialties mirror the pattern: Gastroenterology (Gastroenterology) posts $200k–$1,000k (82 disclosures; national average ≈ $526k–$582k) where single high‑pay listings (Idaho $1M; Louisiana $624k–$832k) drive headlines. Dermatology (Dermatology) spans $120k–$1,000k with a practical cluster $350k–$600k and a 35% disclosure rate. Emergency Medicine (Emergency Medicine) shows rural premiums (single annualized listings up to $480k and hourly $200–$300) against a floor near $250k but with only 47 disclosures from 762 postings.
Procedural vs cognitive: proceduralists with billable procedural volume or leadership (GI, Interventional Cardiology, Anesthesia, Dermatology’s Mohs/cosmetic roles) set the ceiling. Cognitive specialties (Psychiatry, Infectious Disease, Rheumatology) show compression around mid‑to‑upper third of physician pay but still reflect the rural scarcity premium in places. Psychiatry (Psychiatry) ranges $125k–$550k with averages near $298k–$340k — volume in CA/NY but outsized pay available in smaller states.
Surgical Specialties
Surgery still sits at the top of the list, but the distribution is uneven. Orthopedics (Orthopedics) reports $350k–$975k (avg ≈ $578k–$649k) with Iowa and select Midwest markets paying up to $850k. Neurosurgery (Neurosurgery) posts an eye‑watering $250k–$1.1M range (but only 6 disclosures; avg ≈ $705k–$808k). OB/GYN (ObGyn) has depth (1,261 listings, 290 disclosures) and a $125k–$750k spread; the highest averages live in low‑supply states (South Dakota $422k–$566k). Otolaryngology (ENT) clusters around $270k–$778k, national average ≈ $494k–$551k, with Wyoming and Washington paying top of market.
Observationally: surgical compensation remains dominated by scarcity and volume. Where a system needs a surgeon and is the only buyer within a region, the price spikes. Where training pipelines and urban supply meet, volume doesn’t buy premium pay.
Advanced Practice Providers
NPs (Nurse Practitioner) and PAs (Physician Assistant) are their own market. Both are large and liquid: NPs show 1,786 listings with 771 disclosures (range $90k–$400k; average ≈ $145k–$185k). PAs show 1,233 listings with 539 disclosures (range $45k–$400k; average ≈ $153k–$194k). The notable spread between NPs and PAs is modest — both role types cluster in the low‑to‑mid six‑figure band for full‑time work — but state variance is meaningful. North Carolina and parts of the Midwest offer the best NP combination of volume and pay; Tennessee, North Dakota and select Midwest states are top PA markets by average.
Context: APP compensation does not compete with physician pay; it is a parallel market governed by supply, employer standardization, and state scope laws. The largest difference is geographic: APPs, like physicians, win most by being willing to move to undersupplied states.
Cross‑Cutting Observations
1) Geographic inversion is the single dominant pattern. Repeated examples: Cardiology ceilings in small Illinois towns; Gastroenterology’s $1M Idaho posting; Hospitalist $600k in Corning, NY; Orthopedics $850k in Iowa. High listing counts (NY, CA, FL, TX) often correspond to lower disclosed pay or silence.
2) Transparency is still a gating problem. Specialty disclosure rates vary wildly: Emergency Medicine 6.2%; Nephrology 5.7%; Cardiology‑Interventional 8.3%; Internal Medicine ~30.9%; Dermatology ~35.1%; NPs and PAs ~43%. When a handful of listings define a national ceiling, employers who publish numbers win attention and bargaining leverage.
3) Scarcity + scope = cash. Leadership, medical directorships, ASC stakes, and full‑scope procedural roles routinely add $100k+. Examples appear across Anesthesia, Gastroenterology, and Physiatry where the $350k–$400k band is transformed into upper‑six figures once administrative or ownership scope is attached.
4) Volume ≠ pay. More listings often signal supply depth, not generosity. New York and California are the clearest examples: high volume but frequently below‑midpoint pay. Conversely, low‑volume states are paying premiums to recruit.
5) APPs are stabilizers, not disruptors. NP/PA markets are broad and comparatively transparent; they reduce some hiring pressure but don’t compress physician ceilings — they create staffing flexibility that employers leverage, which can blunt urgent premium inflation but not eliminate it where scarcity is acute.
What to watch next month: disclosure rates and whether coastal high‑volume employers begin publishing ranges as rural salary anchors keep climbing. If employers on the coasts continue to stay silent, expect targeted recruitment to accelerate toward the Midwest and Mountain West—and for those regional ceilings to rise again.