
Iowa — population 3.2 million, zero professional sports teams, winters that test the human spirit — is paying orthopedic surgeons $850,000 a year. The national Orthopedics job market currently features 239 active listings spanning more than 40 states, with compensation data available for 34 positions. The full range runs from $350,000 to $975,000, a $625,000 spread that reflects everything from rural community hospital work to high-volume subspecialty practices in major metros. The data reveals a market where geography, volume, and transparency are only loosely correlated — and where the highest per-listing average belongs to a state most physicians couldn’t find on an unmarked map.
👉 Explore Orthopedics job market insights and trends
The Orthopedics Job Market at a Glance
Total listings: 239. Listings with salary data: 34. Full compensation range: $350,000 to $975,000. Average range: $577,971 to $649,343.
The national average sits comfortably in the upper-six-figure tier, but the $625,000 spread between floor and ceiling is wide enough to drive a fully loaded ACL repair cart through. The low end ($350,000) appears repeatedly in Maryland, Vermont, Ohio, and even high-cost New York — suggesting either part-time arrangements, employed positions with limited call, or markets where hospitals have successfully convinced surgeons that lifestyle is its own form of currency. The high end approaches $1 million and clusters in the Midwest and select Northeast markets, where scarcity and surgical volume appear to command meaningful premiums.
States represented: Alabama, Alaska, Arizona, California, Colorado, Connecticut, Delaware, Florida, Georgia, Idaho, Illinois, Indiana, Iowa, Kansas, Kentucky, Louisiana, Maine, Maryland, Massachusetts, Michigan, Minnesota, Mississippi, Missouri, Montana, New Hampshire, New Jersey, New Mexico, New York, North Carolina, North Dakota, Ohio, Oklahoma, Oregon, Pennsylvania, South Dakota, South Carolina, Tennessee, Texas, Utah, Vermont, Virginia, Washington, West Virginia, Wisconsin, and Wyoming.
👉 Browse Orthopedics physician job opportunities
How States Stack Up
Overperformers:
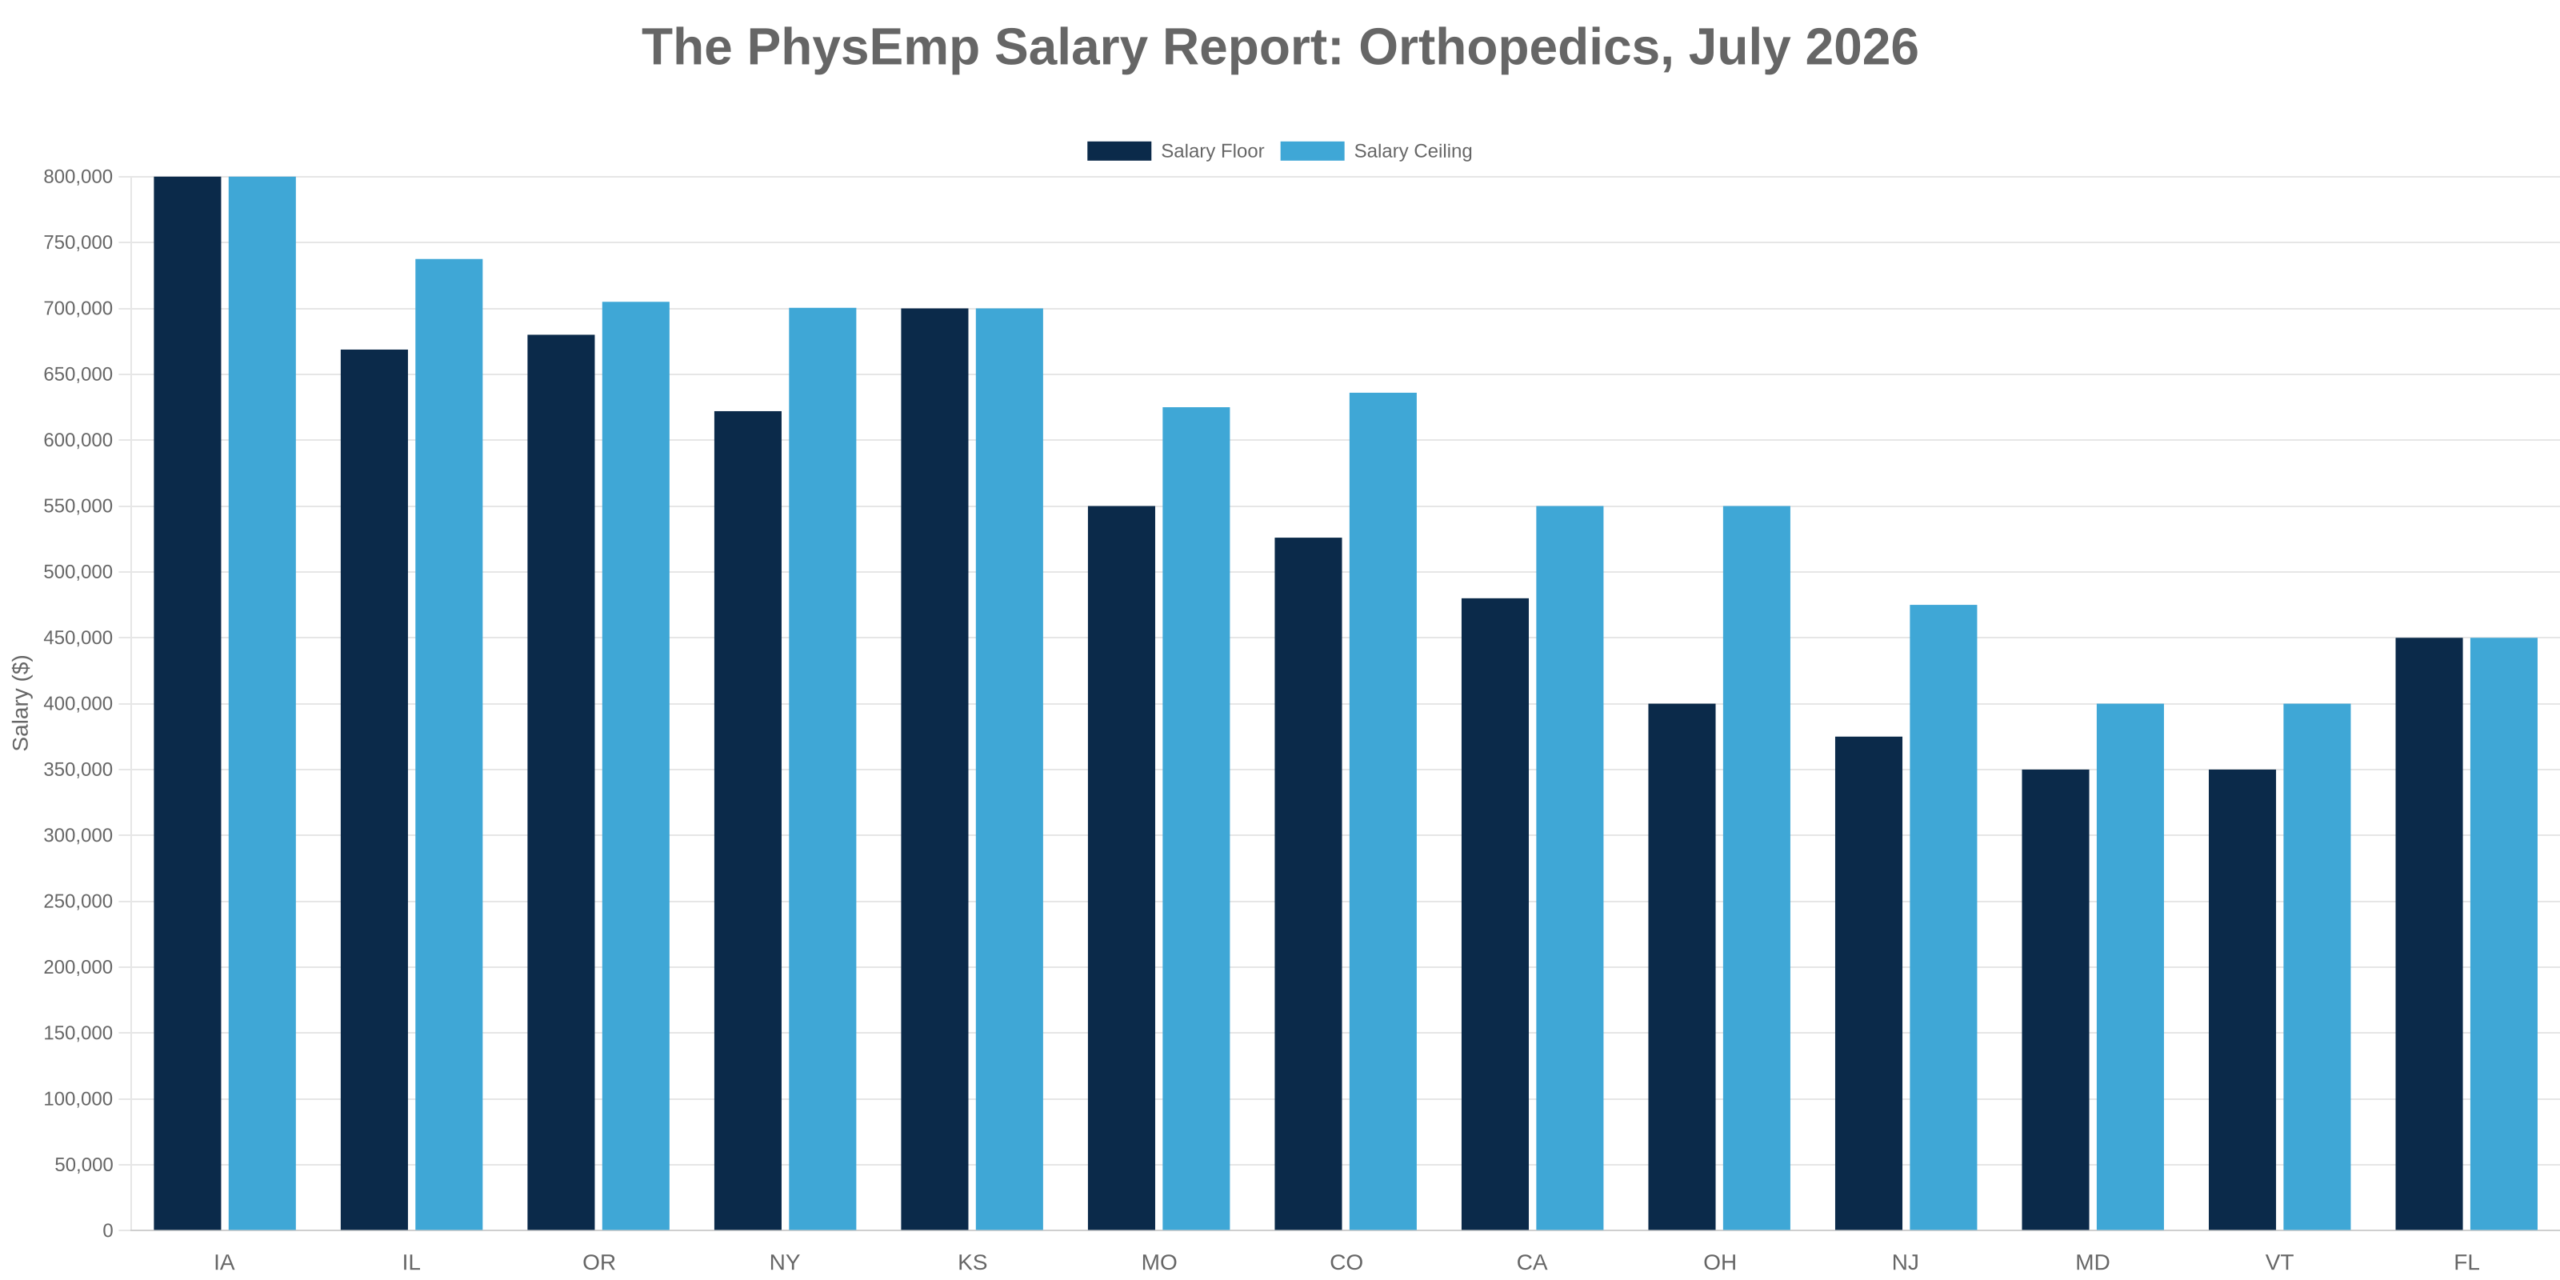
- Iowa: $850,000 flat — the highest single-state average in the dataset, and proof that scarcity pricing works when you’re the only game in three counties.
- Illinois: $668,750 to $737,500 across four listings — consistent, high, and geographically diverse enough to suggest structural demand rather than a single outlier institution.
- Oregon: $680,000 to $705,000 across two listings — West Coast compensation without West Coast cost of living (depending on how you feel about Portland).
- Kansas: $700,000 flat on one listing — another Midwest data point suggesting that flyover country is paying surgeons to stay.
- New York: $622,000 to $700,444 across 15 listings — high volume, high pay, and the only large-market state that delivers both.
Near-average:
- Colorado: $526,000 to $636,000 — right in the national average zone, with one disclosed listing and presumably strong lifestyle appeal doing some of the compensatory work.
- Missouri: $550,000 to $625,000 — near the midpoint despite leading the nation in total job volume, a disconnect worth examining.
- California: $480,000 to $550,000 — below the national average on two listings, which feels low given state tax rates and the cost of a one-bedroom in any city worth living in.
Underperformers:
- Maryland: $350,000 to $400,000 — $175,000 below the national average low, which is a polite way of saying someone is getting a bad deal.
- Vermont: $350,000 to $400,000 — same range as Maryland, but with better skiing and even fewer people.
- New Jersey: $375,000 to $475,000 across two listings — below average in a high-cost state, which suggests either very specific practice limitations or a compensation strategy that assumes proximity to New York is payment enough.
- Ohio: $400,000 to $550,000 — low end trails the national average by nearly $180,000, though the high end approaches respectability.
- Florida: $450,000 flat on one listing — a single data point in a nine-listing state, but if that’s representative, the no-income-tax advantage isn’t showing up in the gross.
Volume leaders: New York leads with 22 listings. Missouri follows with 15. Kentucky posts 14. Texas contributes 12, Indiana 10, and Oregon 11. New York is the only high-volume state with above-average pay and strong salary transparency (15 of 22 listings disclosed). Missouri, despite leading in total postings, disclosed only one salary — and that one fell near the national average. Kentucky, Texas, and Indiana offered zero salary data across 36 combined listings, rendering them high-opportunity zones in volume only.
👉 Compare Orthopedics compensation and opportunities by region
What This Means If You’re a Physician
If your priority is maximum compensation: Iowa, Illinois, Oregon, Kansas, and New York are your targets. The single highest-paying listing in the dataset is $850,000 per year in West Islip, New York — a full-time position with no disclosed scope limitations. Iowa’s $850,000 flat is equally compelling and likely comes with a lower cost of living and a faster commute (because there is no traffic when there are no people).
If your priority is maximum optionality: New York offers 22 listings with strong salary transparency and a $622,000 to $700,444 average — the best combination of volume and pay in the dataset. Missouri, Kentucky, and Texas offer high listing counts but near-zero disclosed compensation, which means you’ll be negotiating blind or filtering through recruiter noise to find the real numbers.
If your priority is balance: Colorado and Oregon offer near- or above-average pay in markets with demonstrated lifestyle appeal. Florida’s single $450,000 listing is underwhelming given the tax structure, and California’s $480,000 to $550,000 range feels low unless the job comes with equity, partnership track, or an address in La Jolla.
👉 Search Orthopedics jobs by location and compensation
What This Means If You’re a Recruiter
Salary transparency rate: 14.2% (34 listings with data divided by 239 total listings). That is not a typo. Fewer than one in six Orthopedics listings disclose compensation, which means the candidate pipeline is being built on phone screens, recruiter relationships, and a lot of wasted time.
For high-volume states like Missouri, Kentucky, Texas, and Indiana — none of which disclosed a single salary across 51 combined listings — recruiters will need to lead with scope, partnership timeline, call schedule, and cultural fit. Compensation will remain a back-end conversation, which works until a candidate gets a disclosed offer from Illinois or Iowa and suddenly your “competitive package” feels like a placeholder.
The volume-pay misalignment is most visible in Missouri: 15 listings, one disclosed salary, and that one came in near the national average despite leading the country in postings. If volume reflects demand, pay should follow. If it doesn’t, the market is either saturated, the roles are underspecified, or employers are counting on geographic inertia to suppress wages.
👉 Post Orthopedics positions on PhysEmp
What’s Driving the Numbers
Geographic scarcity commands a premium, and the Midwest is collecting.
Iowa, Kansas, Illinois, and Oregon — none of which rank in the top ten states by population — are paying at or near the top of the national range. This is not an accident. Lower physician density, aging populations, and hospital systems with limited competition create pricing power for surgeons willing to work in markets that don’t show up in lifestyle magazines. The $850,000 Iowa listing and the $700,000 Kansas posting are not outliers. They are the market clearing price for scarcity.
High-volume states are not high-pay states unless they are New York.
Missouri, Kentucky, Texas, and Indiana combined for 51 listings and zero disclosed salaries. Even when Missouri’s single disclosed figure appeared, it sat near the national average — not above it. Volume signals demand, but it does not guarantee compensation leadership. In these states, recruiters are likely relying on other value propositions, and physicians should assume they’ll need to negotiate harder.
The floor is surprisingly low, and it shows up in surprising places.
Maryland, Vermont, Ohio, and New Jersey all posted starting salaries between $350,000 and $400,000 — as much as $225,000 below the national average low. Some of this may reflect part-time or limited-scope roles. Some of it may reflect employed models with restricted call or administrative responsibilities. But some of it is just low pay in markets where hospitals have more leverage than surgeons, and candidates should ask why.
Salary transparency is the exception, not the rule, and it is concentrated in six states.
Of the 34 listings with disclosed compensation, 29 came from just six states: New York, Illinois, Oregon, Ohio, New Jersey, and California. The remaining 36 states contributed five disclosed salaries across 205 listings. This is a transparency problem and a market efficiency problem. Physicians waste time on roles that don’t meet their floor. Recruiters waste time on candidates who won’t move for the ceiling. And hospitals that do disclose gain an outsize share of attention in a crowded field.
The Bottom Line
The Orthopedics job market is large, well-compensated, and geographically diffuse — but it is also opaque, inconsistent, and only selectively transparent. Physicians who want top dollar should look to the Midwest and select Northeast markets, where scarcity and volume converge. Those who want the most options should focus on New York, Missouri, and Kentucky, but should prepare to negotiate without benchmarks. And those evaluating offers in Maryland, Vermont, or New Jersey should ask hard questions about why the pay is $200,000 below the national average — and whether the answer is worth accepting.
Orthopedic surgery pays well almost everywhere. But the difference between $350,000 and $850,000 is not a rounding error. It is a career.
👉 Browse all Orthopedics physician jobs
👉 Upload your CV to get matched with opportunities
👉 Set alerts for new Orthopedics roles
Salary data based on 34 listings with disclosed compensation. Figures may reflect part-time or specialized roles. This report is informational and should not replace professional judgment or financial planning.