
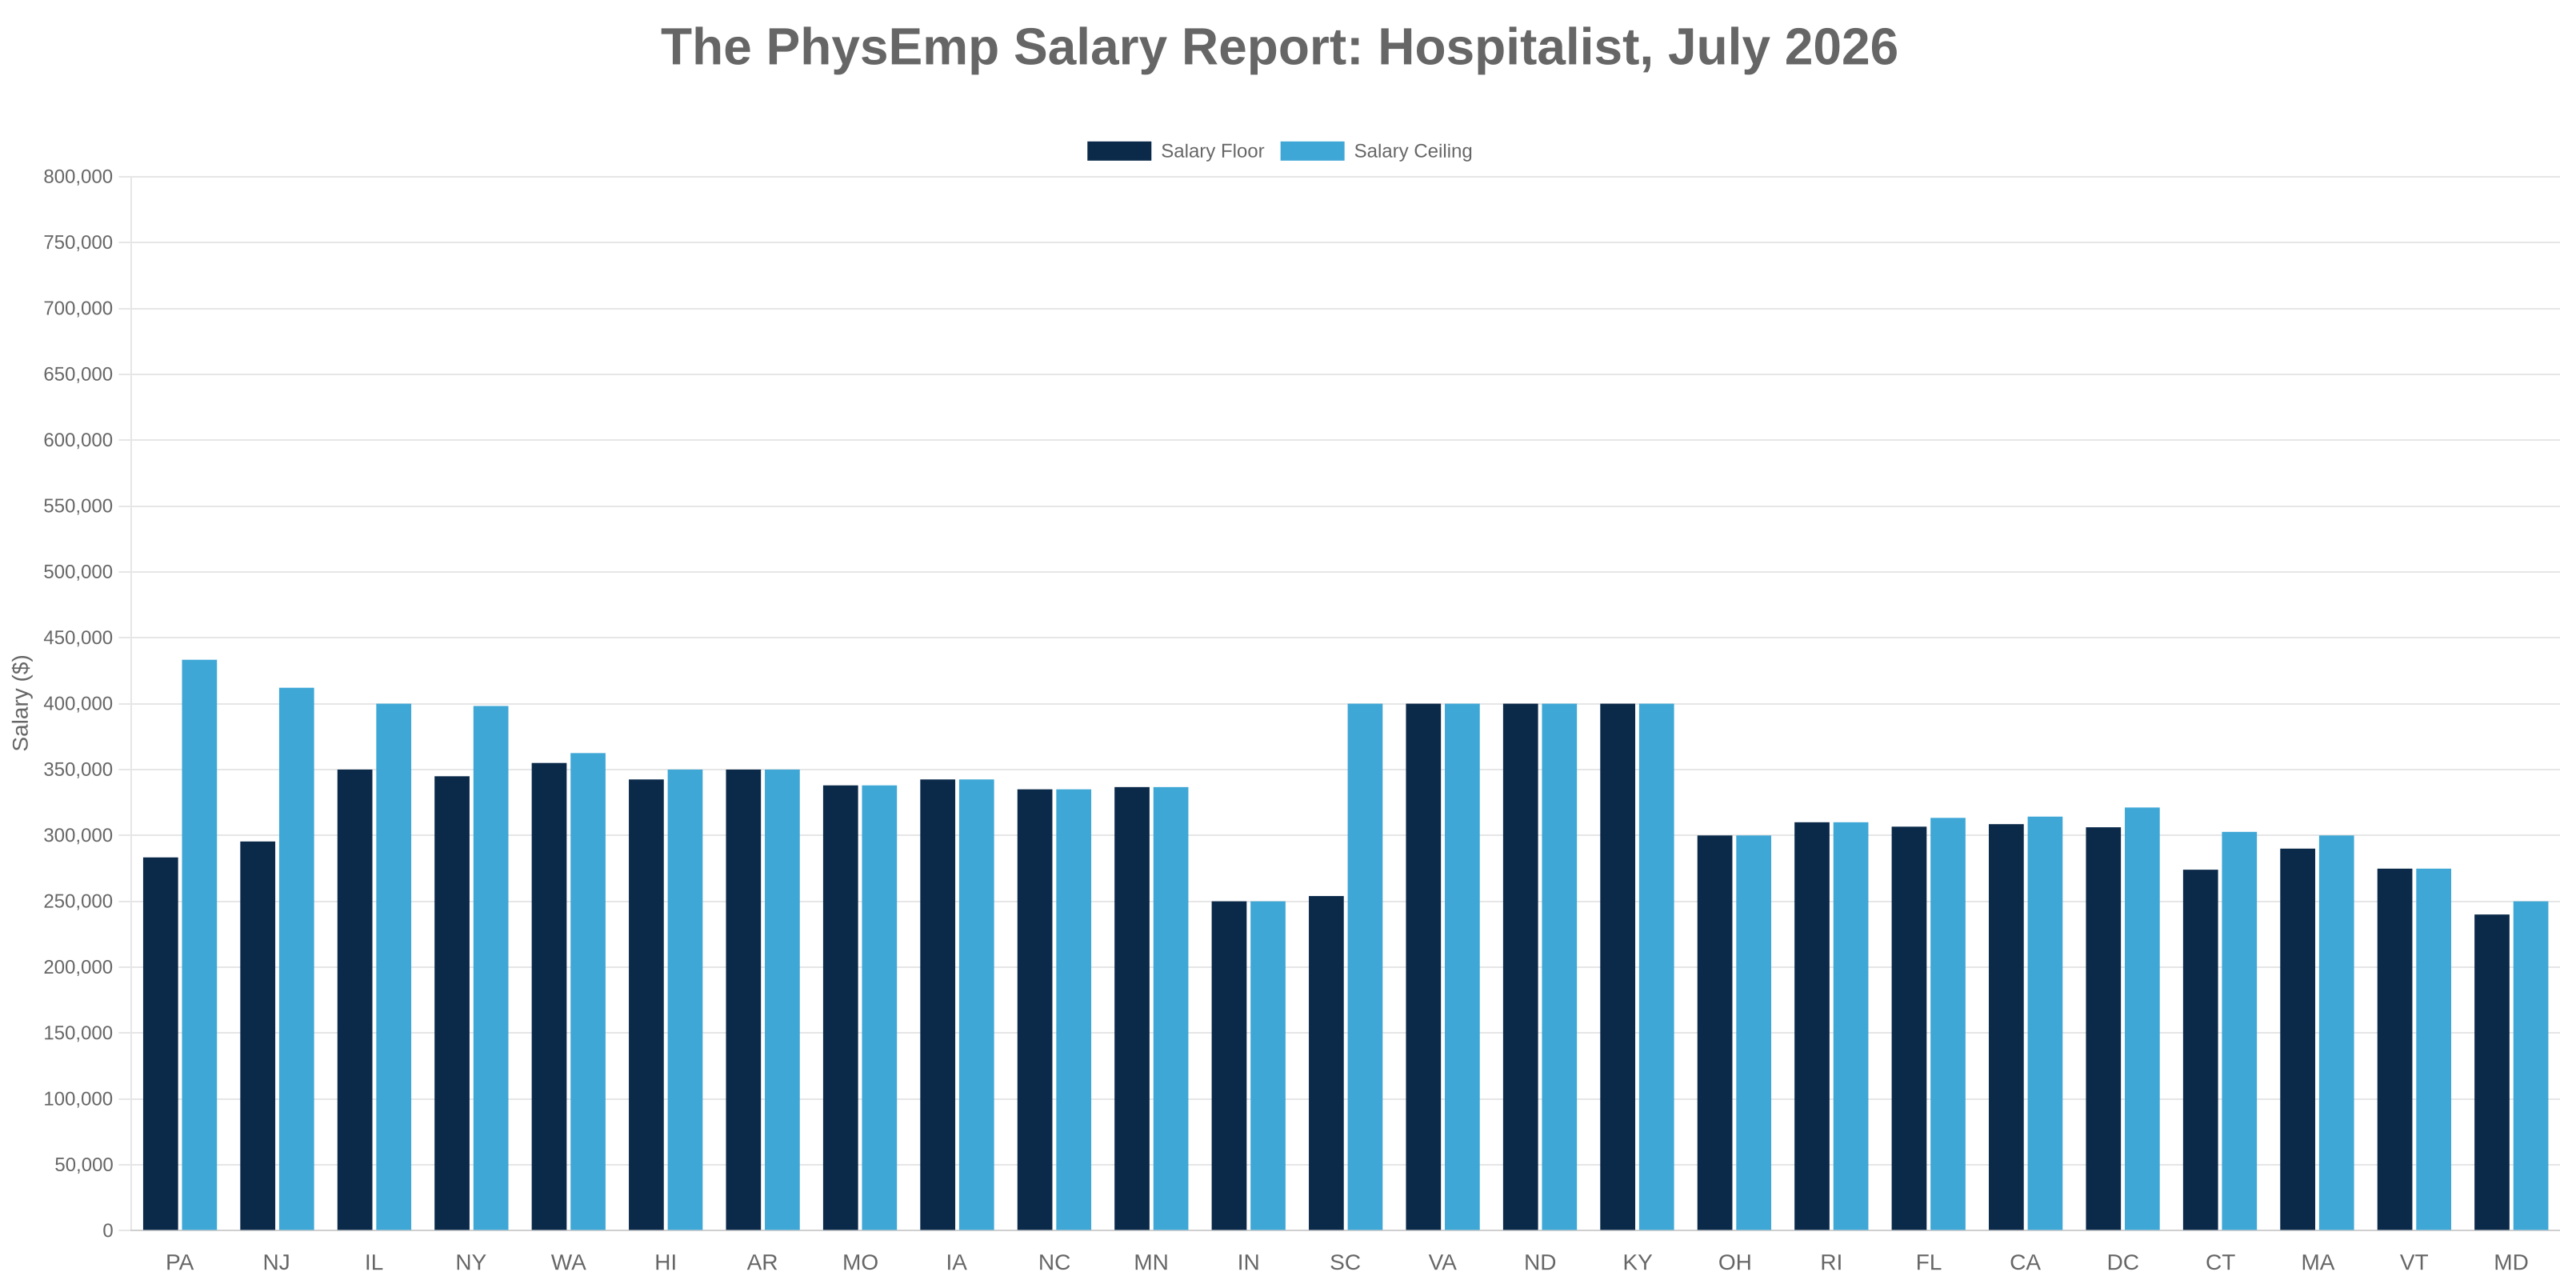
Somewhere in Corning, New York — population roughly 10,000, best known for glass — a hospital system is willing to pay a Hospitalist up to $600,000 a year. That is not a typo, and it is not Manhattan. It is a small city in the Southern Tier of New York offering the highest Hospitalist salary in the country, courtesy of First Docs. The broader dataset covers 543 active Hospitalist listings nationwide, spanning nearly every state in the union. The thesis is straightforward: Hospitalist demand is everywhere, but the money is quiet, uneven, and frequently hiding in places you would not expect.
👉 Explore Hospitalist job market insights and trends
The Hospitalist Job Market at a Glance
Total listings: 543
Listings with salary data: 69
Full salary range: $210,000 to $600,000
National average range: $317,921 to $344,508
The spread is wide enough to drive a service line through. From the $210,000 floor to the $600,000 ceiling, Hospitalist compensation varies by nearly 3x depending on employer, geography, and whatever specific negotiating leverage the candidate happens to bring. Most full-time roles cluster between $250,000 and $400,000, with staffing-firm postings (CompHealth, in particular) anchoring the $300,000 to $325,000 band.
States represented in the dataset: California, New York, Florida, Texas, Tennessee, North Carolina, South Carolina, Alabama, Massachusetts, Missouri, Indiana, Pennsylvania, Washington D.C., Vermont, Connecticut, Iowa, Maryland, New Jersey, Illinois, Rhode Island, Minnesota, West Virginia, Idaho, North Dakota, Arizona, New Mexico, Virginia, Wisconsin, Montana, Maine, Oklahoma, Ohio, Michigan, New Hampshire, Washington, Louisiana, Colorado, Kentucky, Oregon, Georgia, Wyoming, South Dakota, Kansas, Mississippi, Arkansas, Hawaii, Nebraska, Nevada, Utah, and Alaska.
👉 Browse Hospitalist physician job opportunities
How States Stack Up
Overperformers:
- Illinois averages $350,000 to $400,000 on limited disclosures — the highest reported band in the country.
- North Dakota reports a flat $400,000 average, which is a lot of money to earn in a state with more cattle than traffic.
- Virginia matches at $400,000 on one disclosed listing.
- Kentucky also lands at $400,000 across two disclosed listings (a genuinely surprising showing for the Commonwealth).
- Washington State averages $355,000 to $362,500 and remains a consistent West Coast outlier.
- Arkansas comes in at $350,000 on one listing, punching well above its regional weight.
- New Jersey shows $295,424 to $412,091, a spread wide enough to require its own zip code.
- New York averages $344,922 to $398,256, propped up by both NYC and — improbably — Corning.
Near-average:
- Missouri lands at $338,000, notably above the national midpoint despite a Midwest address.
- Iowa averages $342,500, quietly outperforming several coastal markets.
- Hawaii averages $342,500 to $350,000, which sounds nice until you price a gallon of milk in Honolulu.
- Minnesota reports $336,700 flat.
- North Carolina averages $335,000 across two disclosed listings.
- Rhode Island comes in at $310,000.
- Washington D.C. averages $306,200 to $321,200 across five listings.
- California averages $308,571 to $314,286 (a mid-range number in a state where a house costs a career).
- Florida averages $306,667 to $313,333.
- Ohio averages a clean $300,000.
- Pennsylvania spans $283,333 to $433,333, which is less an average than a Rorschach test.
Underperformers:
- Massachusetts averages $290,000 to $300,000 across four listings — cheap, by Northeast standards.
- Connecticut averages $274,000 to $302,700, undercutting nearly every neighboring state.
- Vermont averages $274,800.
- Indiana reports $250,000 on one disclosed listing.
- Maryland averages $240,000 to $250,000, the weakest disclosed band in the dataset.
- South Carolina averages $254,000 to $400,000 on a single listing, which is technically a range and technically unhelpful.
Volume leaders: Tennessee (35 listings, zero salary disclosures), California (31), North Carolina (31), Florida (27), South Carolina (24), Alabama (22, zero disclosures), Massachusetts (21), Texas (16, zero disclosures). The pattern is loud: the highest-volume states are also the least transparent.
👉 Compare Hospitalist compensation and opportunities by region
What This Means If You’re a Physician
If your priority is maximum compensation: Head to Corning, NY, where First Docs is offering $350,000 to $600,000 — the highest ceiling in the dataset. Illinois, North Dakota, Virginia, and Kentucky all average $400,000. New York City remains strong, with Enterprise Medical Recruiting listing $410,000 to $420,000.
If your priority is maximum optionality: Tennessee (35), California (31), North Carolina (31), and Florida (27) offer the most postings. Just accept that Tennessee, Alabama, and Texas volume comes with zero salary transparency.
If your priority is balance: California and Florida offer high volume with mid-range pay, though California’s cost of living quietly eats the delta. Missouri and Iowa deliver surprisingly strong compensation with lower living costs — a genuine value play.
👉 Search Hospitalist jobs by location and compensation
What This Means If You’re a Recruiter
Salary transparency rate: 69 ÷ 543 = 12.7%.
That is a rounding error dressed up as a job market. Nearly 9 out of 10 Hospitalist listings post no compensation whatsoever, and the blackout is worst precisely where volume is highest. Tennessee, Alabama, and Texas combined for 73 listings and zero disclosed salaries. Candidates increasingly self-filter — if the number is not there, the click often is not either.
The volume-pay misalignment is the story. High-volume Southern markets are competing for the same finite pool of physicians as Illinois ($400,000) and New York ($398,000). Recruiters in low-transparency, mid-pay states will need to lead with schedule, patient load, admin support, sign-on bonuses, and loan repayment. Compensation alone will not carry the pitch.
👉 Post Hospitalist positions on PhysEmp
What’s Driving the Numbers
Metro premiums are real, but not universal. New York City and Chicago-area listings anchor the top of the range, and the Corning outlier proves that a single desperate hospital system can outbid entire states. Metropolitan pricing power still exists — it is just increasingly concentrated in specific employers, not entire regions.
Staffing firms are compressing the middle. CompHealth, Enterprise Medical Recruiting, ProMedical Staffing, Tandym Health, and Curare Group listings cluster tightly in the $250,000 to $325,000 band. When roughly a third of disclosed listings come from staffing agencies pricing to a similar model, the “national average” starts to look less like a market signal and more like a spreadsheet.
Underserved markets are pricing in scarcity — sometimes. North Dakota, Kentucky, Arkansas, and rural New York are paying at or above $350,000 to attract Hospitalists to places with limited candidate flow. But Maryland, Indiana, and Vermont show that low-volume does not automatically mean high-pay. Scarcity pricing only kicks in when the employer actually needs to compete.
The volume-pay relationship breaks completely. Tennessee leads in listings and discloses nothing. Illinois posts 8 listings and leads on pay. Volume signals demand, not compensation — and treating them as interchangeable is how candidates end up disappointed on the second call.
The Bottom Line
The Hospitalist market is enormous, uneven, and profoundly opaque. There is real money available — up to $600,000 in the right small town, a reliable $400,000 across several unglamorous states — but finding it requires ignoring roughly 87% of listings that decline to name a number. Volume is loudest in the South. Pay is loudest in the Midwest and rural Northeast. The gap between the two is where candidates and recruiters will spend the next twelve months negotiating.
Hospitalist medicine pays well when you know where to look — and the places that need you most are frequently the ones least willing to say so out loud.
👉 Browse all Hospitalist physician jobs
👉 Upload your CV to get matched with opportunities
👉 Set alerts for new Hospitalist roles
Salary data based on 69 listings with disclosed compensation. Figures may reflect part-time or specialized roles. This report is informational and should not replace professional judgment or financial planning.