
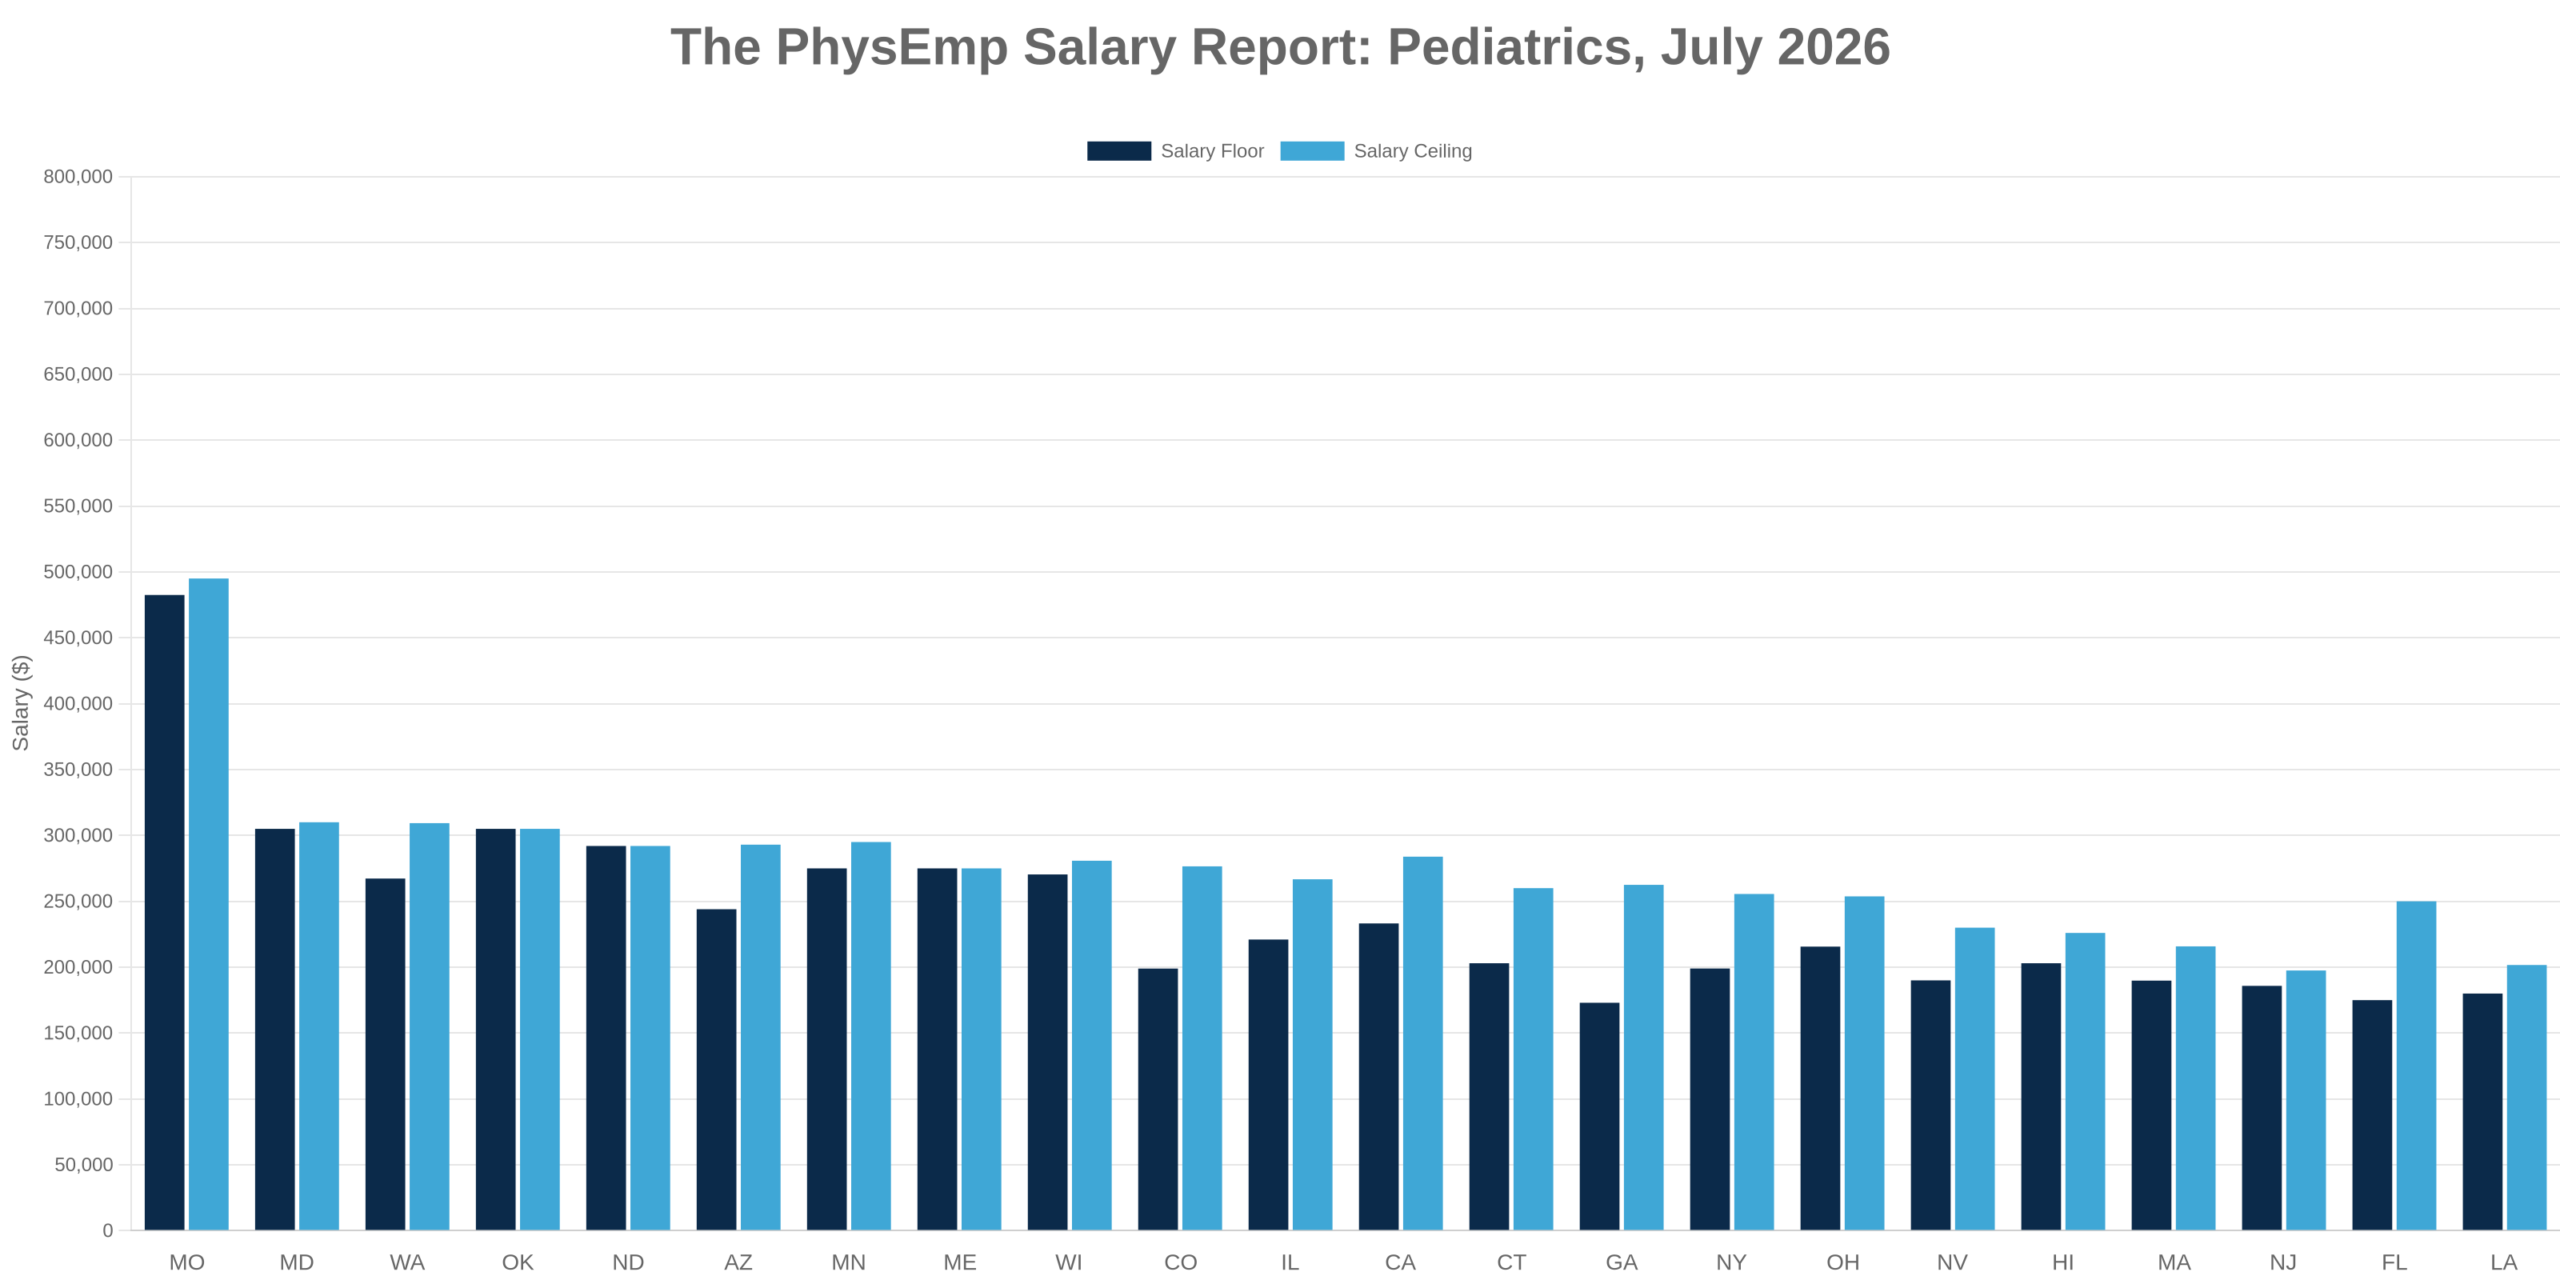
Missouri is paying pediatricians nearly half a million dollars a year. The national floor sits at $121,020. Between those two figures lies the entire economic reality of caring for children in America. There are 584 active Pediatrics listings nationwide, spanning 47 states and territories. The data reveals a market defined less by scarcity than by profound geographic inequality—where you practice matters more than almost anything else.
👉 Explore Pediatrics job market insights and trends
The Pediatrics Job Market at a Glance
Total listings: 584. Listings with salary data: 138. Full salary range: $121,020 to $500,000. Average salary range: $227,229 to $270,545.
The spread is wide enough to drive through in a minivan. The bottom represents part-time or underserved community health roles. The top represents something else entirely (likely administrative scope, rural incentives, or both). Most positions cluster between $180,000 and $300,000, which is to say: comfortable, but not orthopedic surgery comfortable. The average range suggests that employers expect to pay low-to-mid $200Ks to secure a qualified pediatrician, with upside into the $270K range for competitive markets or added responsibilities.
States represented: New York, California, Wisconsin, Massachusetts, Washington, North Dakota, Illinois, Louisiana, New Jersey, Maryland, Minnesota, Florida, Ohio, Connecticut, Arizona, Colorado, Hawaii, Nevada, Missouri, Pennsylvania, Georgia, Texas, Alaska, South Dakota, North Carolina, Arkansas, Idaho, Alabama, Tennessee, Indiana, Michigan, New Mexico, Kansas, New Hampshire, South Carolina, Kentucky, Oregon, Virginia, Mississippi, Utah, Oklahoma, Northern Mariana Islands, West Virginia, Montana, Rhode Island, Wyoming, Maine, Vermont.
👉 Browse Pediatrics physician job opportunities
How States Stack Up
Overperformers: Missouri leads the nation at $482,500 to $495,000, though the figure rests on just two listings and likely reflects specialized or leadership roles. Maryland delivers $305,000 to $310,000 across two listings, making it the most credible high-end metro market. Oklahoma posts a flat $305,000 across three listings—consistent, rural, and well above average. Washington offers $267,283 to $309,331 across nine listings, combining volume with premium pay. North Dakota averages $292,000 flat across three postings, pricing in isolation and scarcity. Minnesota averages $275,000 to $295,000 with minimal data depth. Maine posts a single listing at $275,000, making it a statistical outlier worth watching. Wisconsin shows $270,400 to $280,800, though based on one hourly-rate listing annualized at 2,080 hours.
Near-average performers: California averages $233,222 to $283,886 across 45 salary listings—above the national mean and backed by serious volume. Illinois averages $221,000 to $266,727 across eleven listings, offering a reliable mid-market benchmark. Ohio averages $215,625 to $253,750 across eight postings, landing squarely in the national middle. Connecticut posts $203,000 to $260,000 across five listings. Arizona averages $244,000 to $293,000, but with only two data points. Colorado shows $198,964 to $276,540 across three listings, spanning a suspiciously wide range. Hawaii lists one position at $203,000 to $226,000. Nevada averages $190,000 to $230,000 across two postings.
Underperformers: New York averages $199,015 to $255,568 across thirteen listings—high volume, below-average pay, and a reminder that cost of living does not always translate to compensation. Massachusetts averages $189,813 to $215,813 across eight listings, underperforming for a high-cost state. New Jersey posts $185,833 to $197,500 across six listings, well below the national floor. Louisiana averages $180,000 to $201,667 across three postings. Florida averages $175,000 to $250,000 across six listings, with a floor that ranks among the lowest nationally. Georgia shows $173,010 to $262,500 across two listings—the widest intra-state spread in the dataset and the lowest average floor.
Volume leaders: California leads with 89 listings and delivers above-average pay. Texas follows with 34 listings but discloses zero salary data. New York has 32 listings. Georgia has 28. Florida has 27. Pennsylvania has 23 and also discloses nothing. North Carolina has 20 listings with no pay data. Oregon has 17, also silent. High volume does not guarantee transparency, and in several cases it correlates with below-average or undisclosed compensation.
👉 Compare Pediatrics compensation and opportunities by region
What This Means If You’re a Physician
If your priority is maximum compensation: Missouri, Maryland, and Oklahoma lead on raw dollars, but with minimal job volume. Washington offers the best combination of high pay and listing depth. The single highest-paying listing in the dataset is in Fresno, California, offering $240,000 to $390,000 (the $390,000 figure likely reflects partnership track, productivity bonuses, or scope expansion). If you are willing to move to the northern plains or rural Midwest, the data rewards that flexibility.
If your priority is maximum optionality: California offers 89 listings with disclosed salaries in 45 of them—more than any other state. Texas has 34 listings but no pay transparency, which limits planning. New York has 32 listings with modest pay. If you want choices and competitive compensation in the same market, California is the clear answer.
If your priority is balance: Illinois, Ohio, and Connecticut offer near-average pay, reasonable listing counts, and salary transparency. Washington provides premium pay without the volume crush of California. Avoid Florida and Georgia unless you have non-financial reasons to be there—they combine high listing counts with some of the lowest disclosed pay in the nation. New York and Massachusetts underperform relative to their cost of living, which should inform your negotiation posture.
👉 Search Pediatrics jobs by location and compensation
What This Means If You’re a Recruiter
Salary transparency rate: 23.6% (138 of 584 listings disclosed compensation). That is low. It signals either a buyer’s market where employers believe they can withhold figures, or a fragmented market where compensation is too variable to advertise up front. Either way, it creates friction in the candidate pipeline. Physicians will apply to fewer roles. Time-to-fill will extend. Offer acceptance rates will decline.
Volume-pay misalignments are everywhere. Texas has 34 listings and discloses nothing. Pennsylvania has 23 listings and discloses nothing. North Carolina has 20 listings and discloses nothing. Georgia has 28 listings and pays below average when it does disclose. If you are recruiting in these states, you cannot lead with compensation. You will need to lead with location, lifestyle, partnership track, loan repayment, or scope. In contrast, California combines volume and pay transparency—it is a recruiter’s dream if your budget can support it. Missouri and Maryland pay well but offer limited inventory, meaning you will face steep competition for a small candidate pool.
👉 Post Pediatrics positions on PhysEmp
What’s Driving the Numbers
Geographic inequality dominates the market: The gap between Missouri’s $482,500 average and Georgia’s $173,010 floor is not an anomaly—it is the story. Pediatrics compensation is shaped more by regional labor supply and state Medicaid reimbursement structures than by clinical demand. States with physician shortages (North Dakota, Oklahoma, Maine) pay premiums. States with oversupply or low reimbursement rates (Florida, Georgia, Louisiana) compress wages. The result is a market where a pediatrician’s earning potential can double based solely on ZIP code.
Salary transparency remains inconsistent and strategically deployed: Only 23.6% of listings disclose pay, and the pattern is not random. High-paying states (Washington, California, Illinois) disclose frequently. High-volume, low-paying states (Texas, Pennsylvania, Georgia) disclose rarely. This suggests that salary transparency is being used as a filtering mechanism: employers with competitive offers advertise them, and employers with below-market offers do not. Physicians should interpret silence as a signal and adjust their expectations accordingly.
Volume does not correlate with compensation: California is the exception—it leads in both volume and pay. But Texas, Pennsylvania, and Georgia prove the rule: high listing counts do not translate to high salaries. In fact, volume may suppress wages in states where supply meets or exceeds demand. Conversely, low-volume states like Missouri, Maryland, and North Dakota pay premiums precisely because they lack depth. For physicians, this means that chasing volume is not the same as chasing compensation. For recruiters, it means that high-volume markets require non-salary differentiation to compete.
Part-time and hourly roles distort the floor but not the ceiling: The national floor of $121,020 almost certainly reflects part-time or hourly roles annualized at reduced schedules. The Wisconsin listing at $130 to $135 per hour annualizes to $270,400 to $280,800 at full-time equivalency, which is competitive. This suggests that part-time roles are not systematically undervalued on a per-hour basis—they simply reduce total annual earnings. The floor is noisy, but the ceiling remains intact. Physicians evaluating part-time opportunities should normalize offers to hourly rates before comparing them to full-time roles.
The Bottom Line
The Pediatrics job market offers broad geographic distribution, inconsistent pay transparency, and a compensation range wide enough to reflect two entirely different careers. Physicians have leverage in undersupplied markets and should use it. Employers in high-volume, low-pay states will struggle to compete without transparency or differentiation. The market is not broken—it is segmented.
You can make $121,020 caring for children, or you can make $500,000 caring for children, and the difference is mostly about where you are willing to live.
👉 Browse all Pediatrics physician jobs
👉 Upload your CV to get matched with opportunities
👉 Set alerts for new Pediatrics roles
Salary data based on 138 listings with disclosed compensation. Figures may reflect part-time or specialized roles. This report is informational and should not replace professional judgment or financial planning.