A Pediatrics position in Saint Louis is offering $475,000 to $500,000 annually. For context: that is approximately double what most pediatricians earn, and roughly equivalent to what some subspecialty surgeons command for work that does involve making people bleed. The national Pediatrics job market currently features 606 active listings spanning more than 40 states, with salary data disclosed in 157 of them. The data reveals a market defined less by consistency than by wild geographic arbitrage, where state borders matter more than credentials.
👉 Explore Pediatrics job market insights and trends
The Pediatrics Job Market at a Glance
Total listings: 606
Listings with salary data: 157
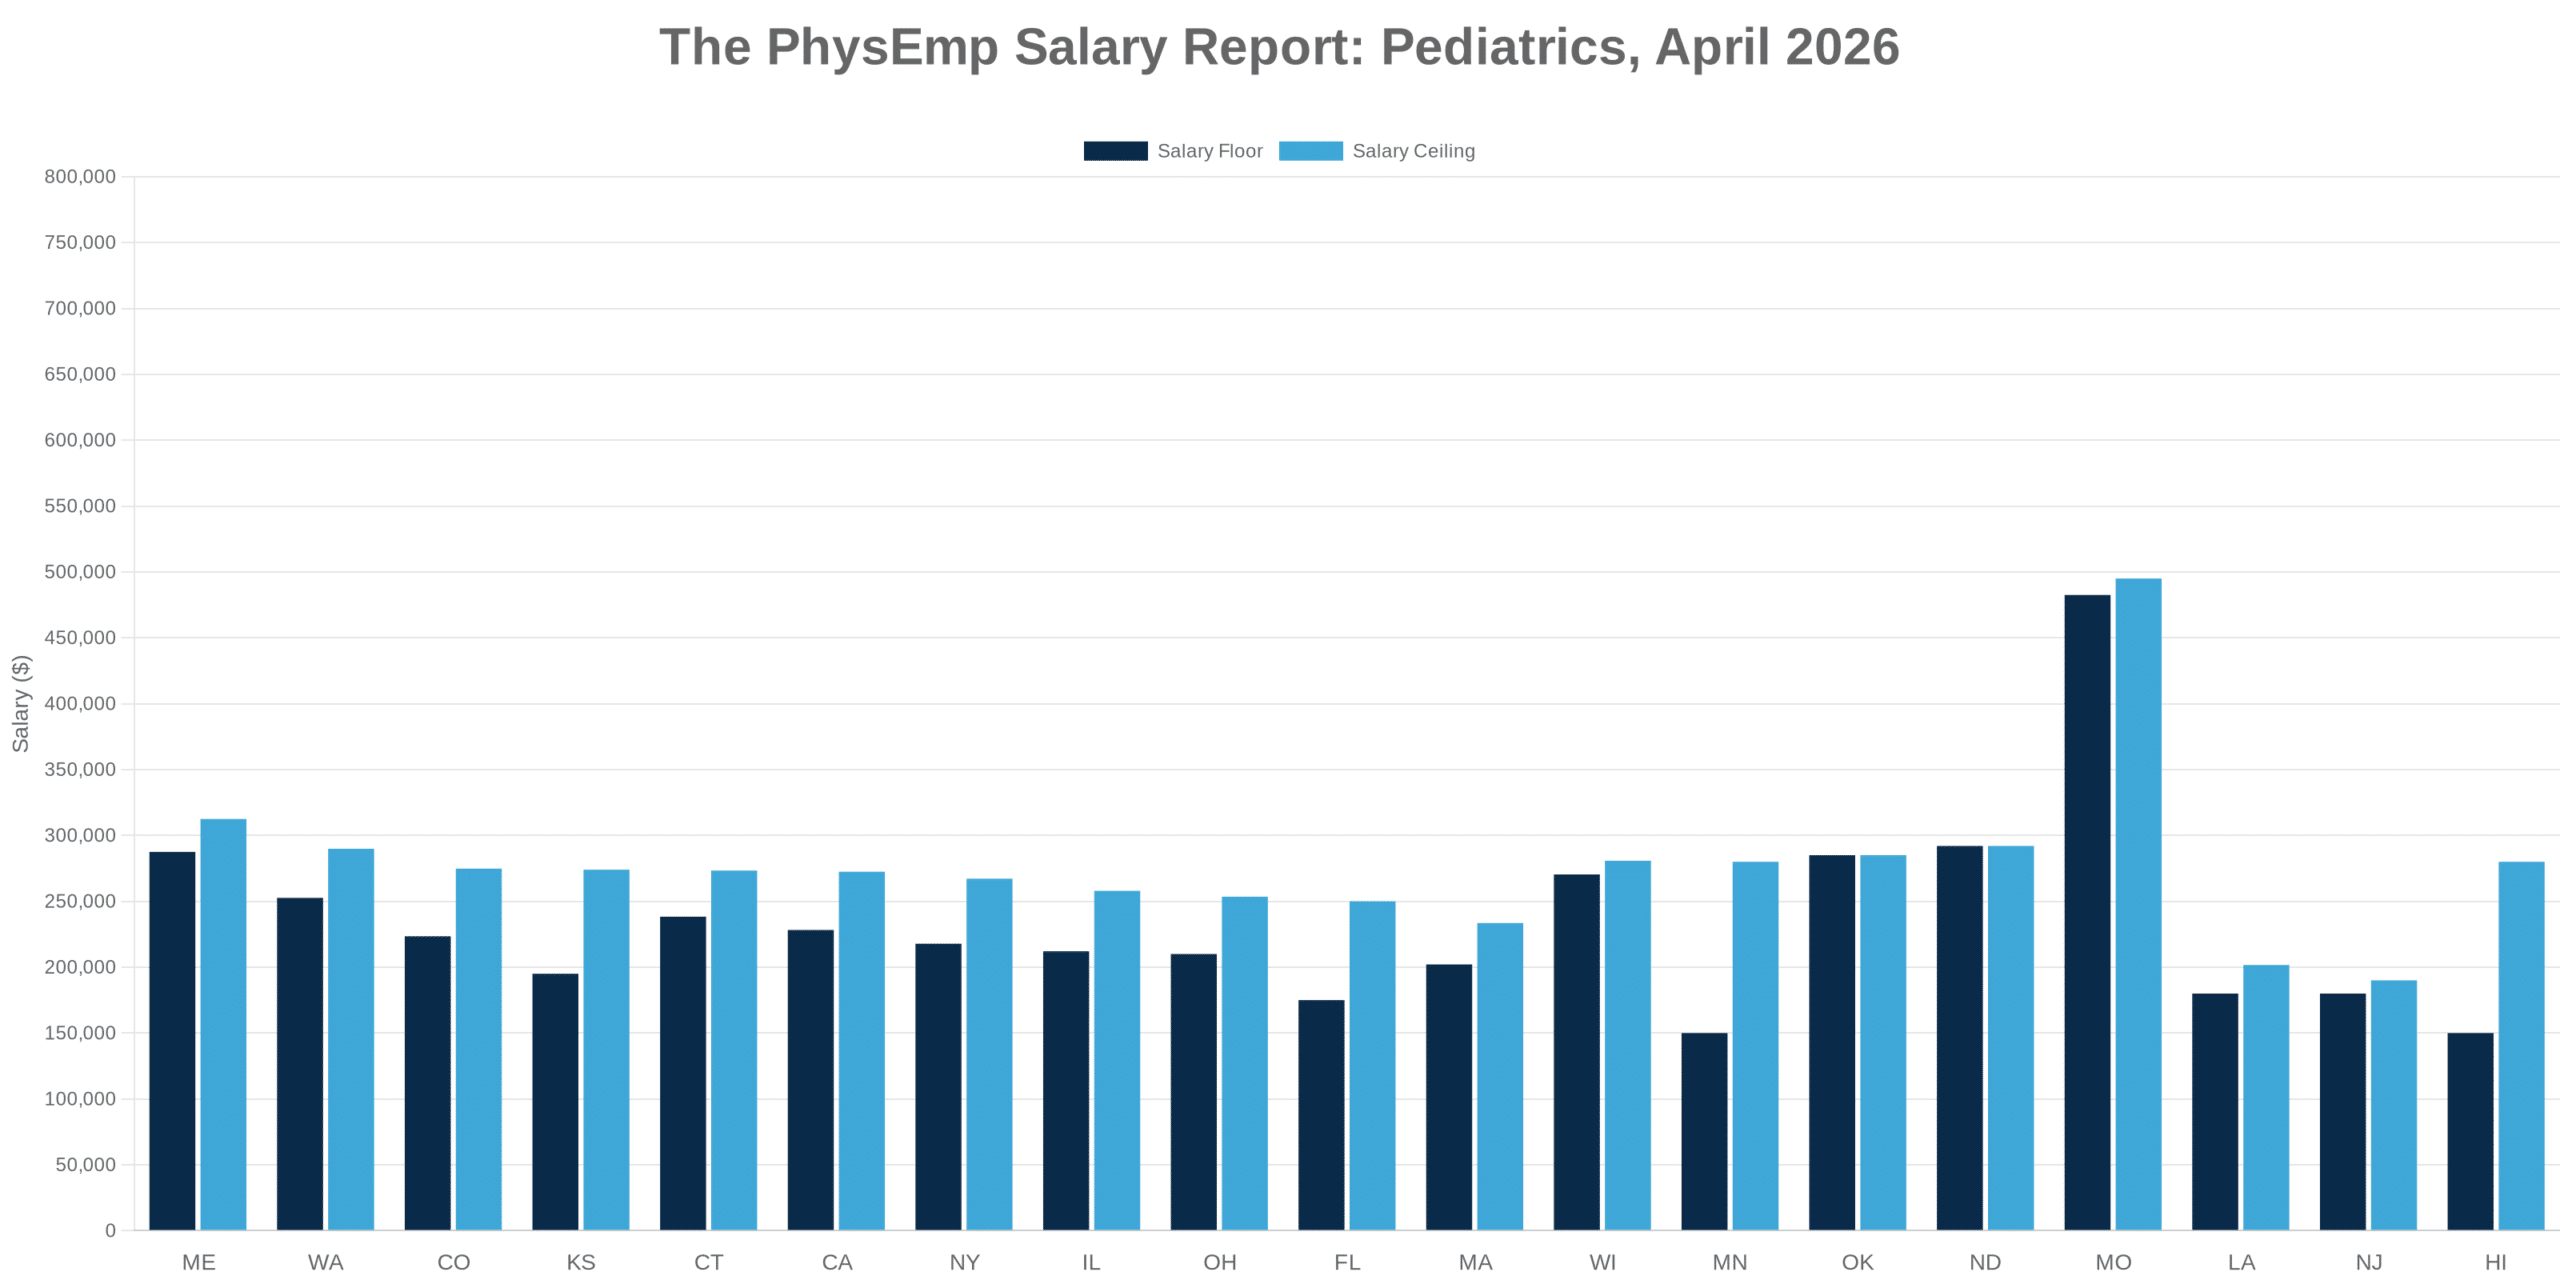
National salary range: $120,000 to $500,000
Average salary range: $224,560 to $266,799
The four-to-one spread between floor and ceiling is remarkable even by physician standards. Most positions cluster in the $200,000 to $300,000 band, which represents the stable center of gravity for employed, outpatient-focused Pediatrics work. But the extremes tell the real story. The bottom reflects part-time roles, underserved rural markets with limited negotiating leverage, or both. The top reflects aggressive recruitment in high-need markets where scarcity has pricing power.
States with job listings: Alabama, Alaska, Arizona, Arkansas, California, Colorado, Connecticut, Florida, Georgia, Hawaii, Idaho, Illinois, Indiana, Kansas, Kentucky, Louisiana, Maine, Maryland, Massachusetts, Michigan, Minnesota, Mississippi, Missouri, Nevada, New Hampshire, New Jersey, New Mexico, New York, North Carolina, North Dakota, Ohio, Oklahoma, Oregon, Pennsylvania, Rhode Island, South Carolina, South Dakota, Tennessee, Texas, Utah, Vermont, Virginia, Washington, West Virginia, Wisconsin, Wyoming.
👉 Browse Pediatrics physician job opportunities
How States Stack Up
Overperformers: Missouri leads the nation with an average range of $482,500 to $495,000, a figure so high it suggests either desperation or a bidding war (likely both). Maine follows at $287,500 to $312,500, proving that rural New England will pay a premium to keep exam rooms staffed. North Dakota averages $292,000, continuing its tradition of pricing in isolation and winter. Oklahoma posts $285,000 across a single data point, which either reflects an outlier or an emerging trend. Washington averages $252,617 to $289,887, combining West Coast cost structures with competitive recruitment. Wisconsin checks in at $270,400 to $280,800, though this reflects only one disclosed listing.
Near-average: California averages $228,237 to $272,462 across 65 salary listings, a near-perfect match for the national baseline. Connecticut posts $238,333 to $273,333, slightly above center. New York averages $217,813 to $267,159, which is unremarkable by design. Illinois comes in at $212,056 to $257,944, placing it squarely in the middle. Ohio averages $210,000 to $253,500, and Massachusetts sits at $202,091 to $233,500. Colorado and Kansas each report limited data but fall within expected ranges.
Underperformers: Minnesota and Hawaii both start at $150,000, though their upper bounds reach $280,000 (each reflects a single listing with wide-range transparency). Florida averages $175,000 to $250,000, a disappointing showing for a state with 27 active listings. New Jersey posts $180,000 to $190,000, making it one of the least competitive markets despite proximity to high-cost metro areas. Louisiana averages $180,000 to $201,667, continuing its pattern of below-market physician compensation across specialties.
Volume leaders: California dominates with 121 listings. Texas contributes 28 listings but discloses zero salary figures. New York offers 40 listings with transparency on 15. Florida, Illinois, Pennsylvania, and North Carolina each post more than 20 openings, though Pennsylvania and North Carolina provide no salary data. High volume does not correlate with high pay—California leads in listings but sits at the national average, while Missouri leads in salary with just 16 total postings.
👉 Compare Pediatrics compensation and opportunities by region
What This Means If You’re a Physician
If your priority is maximum compensation: Target Missouri and Maine. The highest-paying listing in the dataset is located in Saint Louis, Missouri, offering $475,000 to $500,000 annually for a standard Pediatrics role. Maine offers the second-highest state average at $287,500 to $312,500, with only four total listings and two salary disclosures. Both states offer limited volume, meaning competition for these roles will be significant and timing will matter.
If your priority is maximum optionality: California provides 121 listings with 65 salary disclosures, more than any other state by a factor of two. Compensation averages $228,237 to $272,462, which is middle-of-the-road but stable. New York contributes 40 listings with moderate transparency and comparable pay. For physicians who value choice, geographic flexibility, and the ability to compare multiple offers in real time, these two states represent the deepest pools.
If your priority is balance: Washington offers strong compensation ($252,617 to $289,887) with reasonable job volume (14 listings, 9 with salary data) and access to urban, suburban, and rural practice settings. North Dakota and Wisconsin post higher average salaries but with minimal disclosed listings. Illinois and Ohio combine solid pay, double-digit listings, and cost-of-living structures that stretch take-home income further than coastal peers.
👉 Search Pediatrics jobs by location and compensation
What This Means If You’re a Recruiter
The salary transparency rate in this market is 25.9 percent (157 listings with data divided by 606 total listings). That is low even by healthcare recruiting standards, and it has consequences. Physicians scrolling through undisclosed listings will skip to competitors who lead with numbers, particularly in a specialty where compensation is known to vary wildly by geography and payer mix. In high-volume states with poor transparency—Texas, Pennsylvania, North Carolina, Georgia—recruiters will need to lead with lifestyle, schedule predictability, or partnership track instead of comp, which works only if those features are genuinely differentiated.
The volume-pay misalignment is severe. California, Texas, and Florida combine for 176 listings but deliver underwhelming or absent salary data. Missouri, Maine, and North Dakota post the highest average salaries but contribute only 21 combined listings. For recruiters working in high-volume, low-transparency states, the pipeline risk is real: strong candidates will chase disclosed high-comp listings in smaller markets rather than gamble on undisclosed averages in saturated ones. If you are recruiting in Florida at $175,000 to $250,000, you are competing against Missouri at $475,000 to $500,000. Adjust accordingly.
👉 Post Pediatrics positions on PhysEmp
What’s Driving the Numbers
Part-time and reduced-schedule roles distort the floor. The $120,000 to $150,000 bottom reflects positions that are either explicitly part-time or structured around school-based, public health, or urgent care models with limited hours. These roles serve a real market need—physicians seeking flexibility or nearing retirement—but they compress the lower bound in ways that misrepresent full-time earning potential. Any analysis of the Pediatrics market must segment by FTE to avoid conflating fundamentally different job structures.
Underserved and rural markets price in scarcity, but inconsistently. Missouri, North Dakota, and Maine all rank among the highest-paying states, and all share low population density and provider shortages. But South Dakota, Wyoming, and New Mexico—equally rural and underserved—report zero salary transparency and modest job volume, suggesting either weaker health system capital or a reliance on loan repayment and visa sponsorship instead of cash comp. Scarcity alone does not command a premium; it requires a health system willing and able to pay for it.
High-volume states do not lead on pay. California, Texas, and Florida contribute 28 percent of all listings but sit at or below the national salary average where data exists. This is not a cost-of-living adjustment—it is a supply-demand signal. These states produce large numbers of residency graduates, host major health systems with standardized pay bands, and attract physicians for non-financial reasons (weather, family, lifestyle). Recruiters in these states are not competing on comp; they are competing on everything else.
Leadership, fellowship training, and subspecialty scope do not command a visible premium in this dataset. The highest-paying listing in Saint Louis is described as a standard Pediatrics role, not a division chief or adolescent medicine specialist. The market rewards geography and scarcity more than it rewards credentials or scope expansion. That is unusual compared to other specialties, and it suggests that Pediatrics compensation is driven more by local market failure (no one will take this job unless we pay this much) than by value-based differentiation.
The Bottom Line
The Pediatrics job market is geographically vast, modestly transparent, and defined by dramatic pay variation that has little to do with complexity of care and everything to do with where the exam room is located. A pediatrician in Saint Louis can earn $475,000. A pediatrician in New Jersey can earn $180,000. Both will see sore throats, give vaccines, and counsel anxious parents. One will simply do it in a place that has run out of other options.
There is no national Pediatrics labor market—only 40 state markets operating on different economic planes.
👉 Browse all Pediatrics physician jobs
👉 Upload your CV to get matched with opportunities
👉 Set alerts for new Pediatrics roles
Salary data based on 157 listings with disclosed compensation. Figures may reflect part-time or specialized roles. This report is informational and should not replace professional judgment or financial planning.


