Someone in Missouri is offering $1,000,000 to fix ears, noses, and throats. At the other end of the spectrum, a New York position starts at $270,235—a figure that would be respectable in most specialties but looks almost quaint when placed beside seven-figure Otolaryngology packages. The national market currently holds 175 active listings spread across 42 states and one U.S. territory. What the data reveals is a market defined by extremes: geographic scarcity commands a premium, volume doesn’t guarantee pay, and the gap between top and bottom is wide enough to fit an entire physician salary inside it.
👉 Explore Otolaryngology job market insights and trends
The Otolaryngology Job Market at a Glance
Total listings: 175
Listings with salary data: 29
Full salary range: $270,235 to $1,000,000
Average salary range: $506,663 to $544,160
The spread is remarkable, even for a surgical subspecialty. The low end sits nearly $200,000 below the average floor, while the ceiling reaches twice the national mean. Most disclosed positions cluster between $350,000 and $550,000, but the outliers—both high and low—suggest that practice setting, geography, and scope dramatically reshape compensation. The 16.6% transparency rate means most of this market operates behind closed doors, but the visible data points to a field where location and leverage matter more than credentials alone.
States with active listings: Illinois, New York, Pennsylvania, Texas, Missouri, Indiana, Florida, New Hampshire, Wisconsin, Washington, Ohio, New Jersey, Tennessee, Connecticut, Kentucky, Nebraska, Nevada, North Carolina, South Carolina, Arizona, Massachusetts, California, Colorado, Vermont, Maryland, Wyoming, Oregon, Minnesota, Georgia, Kansas, South Dakota, West Virginia, Montana, Michigan, Alabama, Arkansas, Oklahoma, North Dakota, Iowa, Mississippi, Maine, and the Northern Mariana Islands.
👉 Browse Otolaryngology physician job opportunities
How States Stack Up
Overperformers:
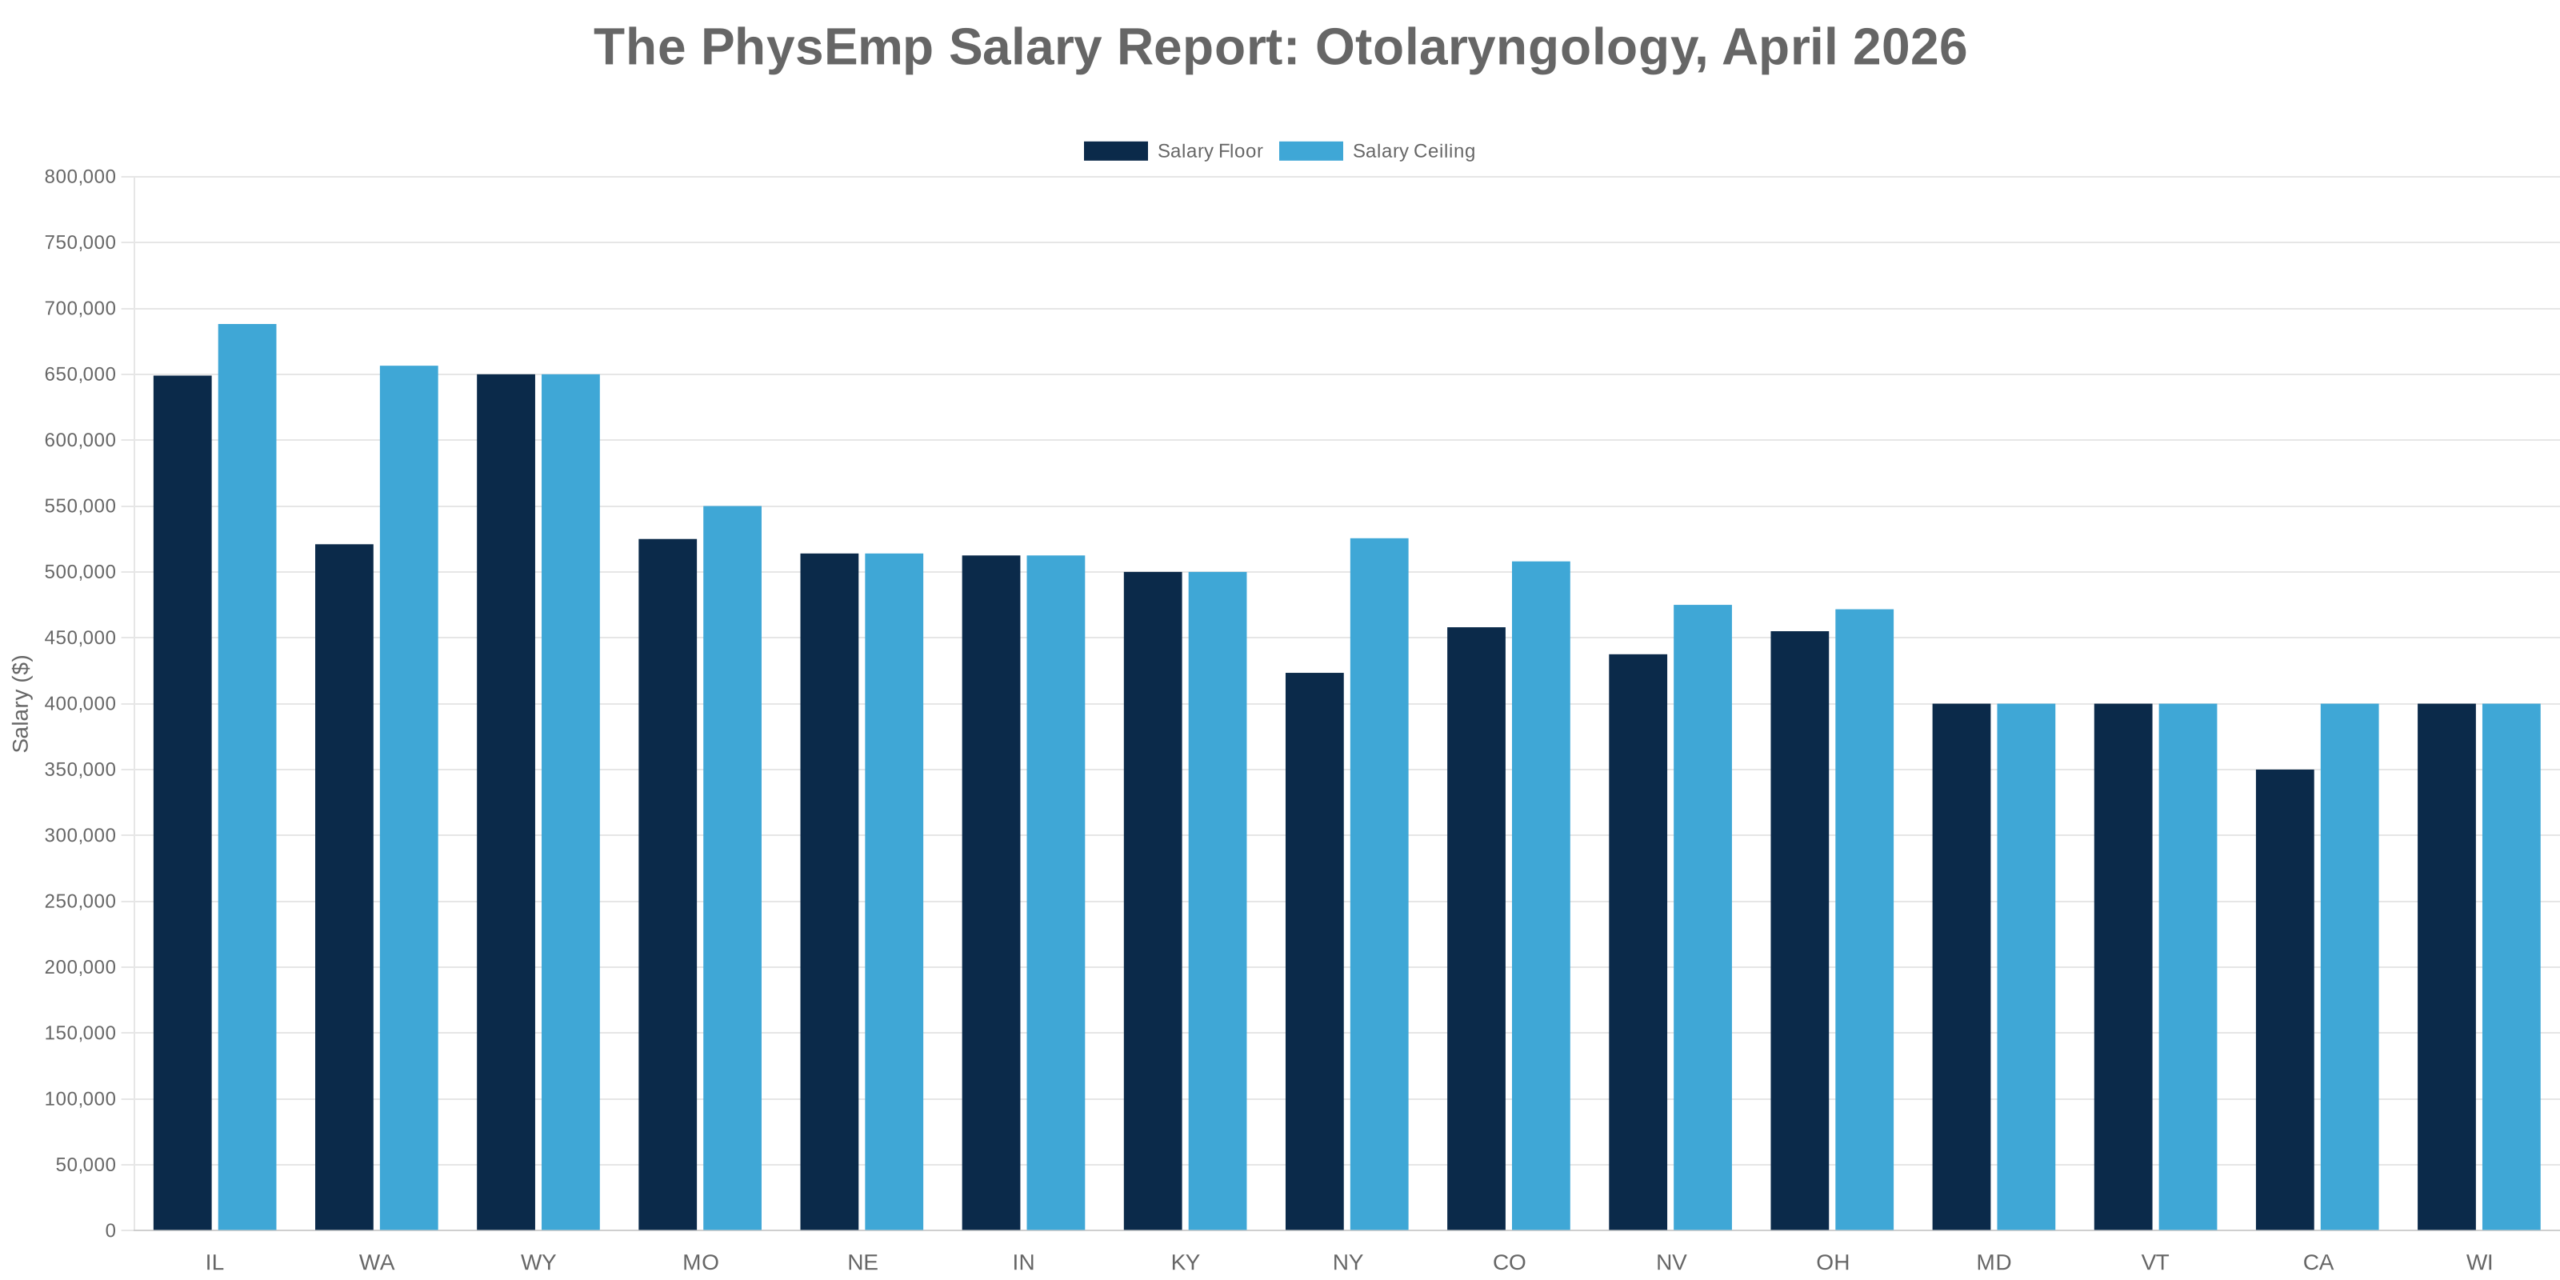
Illinois leads the nation with an average range of $648,996 to $688,163 across six disclosed listings—nearly $150,000 above the national floor. Wyoming offers a flat $650,000 in its single disclosed listing, proof that low-population states will pay top dollar for specialists. Washington follows with $521,000 to $656,500 across two listings, making the Pacific Northwest a legitimate high-compensation zone. Missouri averages $525,000 to $550,000 across two listings, with one position reaching the market’s $1,000,000 ceiling.
Near-Average States:
Indiana reports $512,500 on both ends of its range across two listings—clean, consistent, and just above the national average. Nebraska comes in at $514,000 from one disclosed listing, nearly identical. Kentucky sits at $500,000 flat across two listings, a round number that suggests either standardized offers or limited negotiation. Ohio averages $455,000 to $471,667 across three listings, slightly below the midpoint but within striking distance. Nevada offers $437,500 to $475,000 across two listings. Colorado shows $458,000 to $508,000 from one listing. New York averages $423,412 to $525,558 across three listings, a wide internal spread that hints at market segmentation.
Underperformers:
California averages $350,000 to $400,000 from one disclosed listing—more than $100,000 below the national floor (and this is California, where the cost of living does not forgive). Vermont matches that range at $400,000 flat. Maryland sits at $400,000 on both ends. Wisconsin also reports $400,000 from one listing. These states may offer lifestyle appeal, but they do not offer Otolaryngology physicians top-tier compensation.
Volume Leaders:
Illinois and Pennsylvania each posted 13 listings, followed by New York with 12, Texas with 9, and Missouri, Indiana, Florida, and New Hampshire with 8 apiece. Illinois combines volume with the highest average pay in the country—a rare alignment. Pennsylvania, Texas, Florida, and New Hampshire disclosed no salary data, making them high-volume black boxes. New York disclosed three salaries and came in near the national average, a surprise given its reputation and cost structure.
👉 Compare Otolaryngology compensation and opportunities by region
What This Means If You’re a Physician
If your priority is maximum compensation: Target Illinois, Wyoming, Washington, or Missouri. The single highest-paying listing is in Missouri at $1,000,000 annually, though the listing does not specify city or scope. (The second-highest known listing is in Cape Girardeau, Missouri, at $700,000, which suggests smaller markets are driving the top end.) Illinois offers both the highest average pay and the most opportunities, a combination that reduces risk and maximizes leverage.
If your priority is maximum optionality: Look to Illinois, Pennsylvania, and New York. These three states account for 38 of the 175 listings—more than one in five. Illinois discloses salary data at a higher rate than the other two, making it the most transparent high-volume market. Pennsylvania and New York offer volume but little visibility into compensation, which means you’ll need to negotiate without benchmarks.
If your priority is balance: Consider Ohio, Indiana, Kentucky, or Nebraska. All four states offer compensation within 10% of the national average, reasonable job availability, and lower costs of living than coastal markets. Ohio disclosed salary data in three of five listings, a 60% transparency rate that makes it easier to evaluate offers. Indiana and Kentucky each have multiple disclosed listings, providing useful comparables. Nebraska offers one data point at $514,000, slightly above the national average, in a state where that salary goes further than it would in Illinois or California.
Cost-of-living mismatch alert: California and Maryland both pay $150,000+ below the national average floor despite above-average living costs. New York’s $270,235 low outlier is similarly difficult to justify unless the role is part-time, academic, or structured around a fellowship.
👉 Search Otolaryngology jobs by location and compensation
What This Means If You’re a Recruiter
Salary transparency rate: 16.6% (29 of 175 listings disclosed compensation). This is low even by physician job market standards, and it creates a significant information asymmetry. Candidates evaluating multiple offers will gravitate toward listings with disclosed ranges, particularly in high-volume states where they have options. Recruiters in Pennsylvania, Texas, Florida, and New Hampshire—states with 8 or more listings and zero disclosed salaries—will need to lead with geography, lifestyle, partnership tracks, or scope. Compensation silence in a competitive market is a disadvantage.
Pipeline implications: Illinois is the only state that combines high volume, high pay, and above-average transparency. Expect it to attract a disproportionate share of candidates. Pennsylvania and New York offer volume but no salary visibility, which will slow candidate engagement and increase time-to-fill. Missouri’s $1,000,000 listing will generate interest, but the state’s low overall volume (8 listings, 2 with salary data) limits its ability to absorb a large pipeline.
Volume-pay misalignment: High-volume states that disclose no salary data—Pennsylvania, Texas, Florida, New Hampshire—are at risk of losing candidates to lower-volume, higher-transparency markets. If Pennsylvania’s undisclosed salaries are competitive with Illinois, the lack of transparency is a strategic error. If they’re not competitive, the volume won’t matter. Either way, silence is costly.
👉 Post Otolaryngology positions on PhysEmp
What’s Driving the Numbers
Geographic scarcity drives compensation more than population density.
The highest-paying states are not the largest or wealthiest. Wyoming, with one disclosed listing at $650,000, and Missouri, with a $1,000,000 ceiling, are proof that underserved markets will pay premiums to attract subspecialists. Illinois is the exception—a high-population state with high pay—but even there, the compensation likely reflects urban-rural splits within the state. California and New York, by contrast, show that brand and lifestyle do not command the same premiums they once did. Physicians have options, and the data suggests they are choosing compensation over geography.
The low end of the range is distorted by outliers, not part-time roles.
The $270,235 floor comes from a single New York listing. It sits $153,000 below the next-lowest disclosed salary and $236,000 below the national average low. This is not a part-time salary—it’s an anomaly. Remove it, and the effective floor rises to $350,000, which tightens the spread and makes the market look more rational. The presence of the outlier suggests either a highly specialized academic role, a fellowship-adjacent position, or a listing error. Either way, it should not be used as a benchmark.
High-volume states do not consistently offer high pay, but low-volume states do.
Illinois is the only high-volume state with disclosed salaries above the national average. Pennsylvania, Texas, Florida, and New Hampshire each posted 8+ listings but disclosed no salary data, making it impossible to assess whether volume correlates with pay in those markets. Meanwhile, Wyoming (1 listing, $650,000) and Vermont (2 listings, $400,000) show that low-volume states sit at opposite ends of the spectrum. The takeaway: volume signals demand, but it does not signal compensation. Scarcity does.
Transparency is a competitive advantage in a tight market.
States that disclose salary data—Illinois, Ohio, Washington, Nevada—give candidates the information they need to make decisions quickly. States that do not—Pennsylvania, Texas, Florida, New Hampshire—force candidates to wait, negotiate blind, or move on. In a market with 175 listings and 29 disclosed salaries, the listings with data will close faster. The listings without it will sit longer, require more recruiter touches, and lose candidates to more transparent competitors.
The Bottom Line
The Otolaryngology job market is geographically broad, compensation-wise narrow in the middle, and wildly variable at the extremes. Illinois dominates on both volume and pay. Missouri offers the highest ceiling. California and New York offer the most surprising disappointments. The $1,000,000 listing is real, the $270,235 listing is baffling, and the 146 listings without salary data are a missed opportunity for everyone involved.
There is a lot of money available for people who fix ears, noses, and throats—but you will need to leave the coasts, ignore the volume, and follow the transparency to find it.
👉 Browse all Otolaryngology physician jobs
👉 Upload your CV to get matched with opportunities
👉 Set alerts for new Otolaryngology roles
Salary data based on 29 listings with disclosed compensation. Figures may reflect part-time or specialized roles. This report is informational and should not replace professional judgment or financial planning.


