The national salary ceiling for Family Medicine physicians currently sits at $800,000 annually. The floor is $110,000. Between these two points lies one of the most geographically diverse, volume-rich, and compensation-variable markets in American medicine. With 2,955 active listings spread across all 50 states and Washington D.C., the Family Medicine job market offers something for everyone. The data reveals a specialty where rural scarcity and urban volume produce radically different compensation strategies, and where a physician’s choice of ZIP code may matter more than their CV.
👉 Explore Family Medicine job market insights and trends
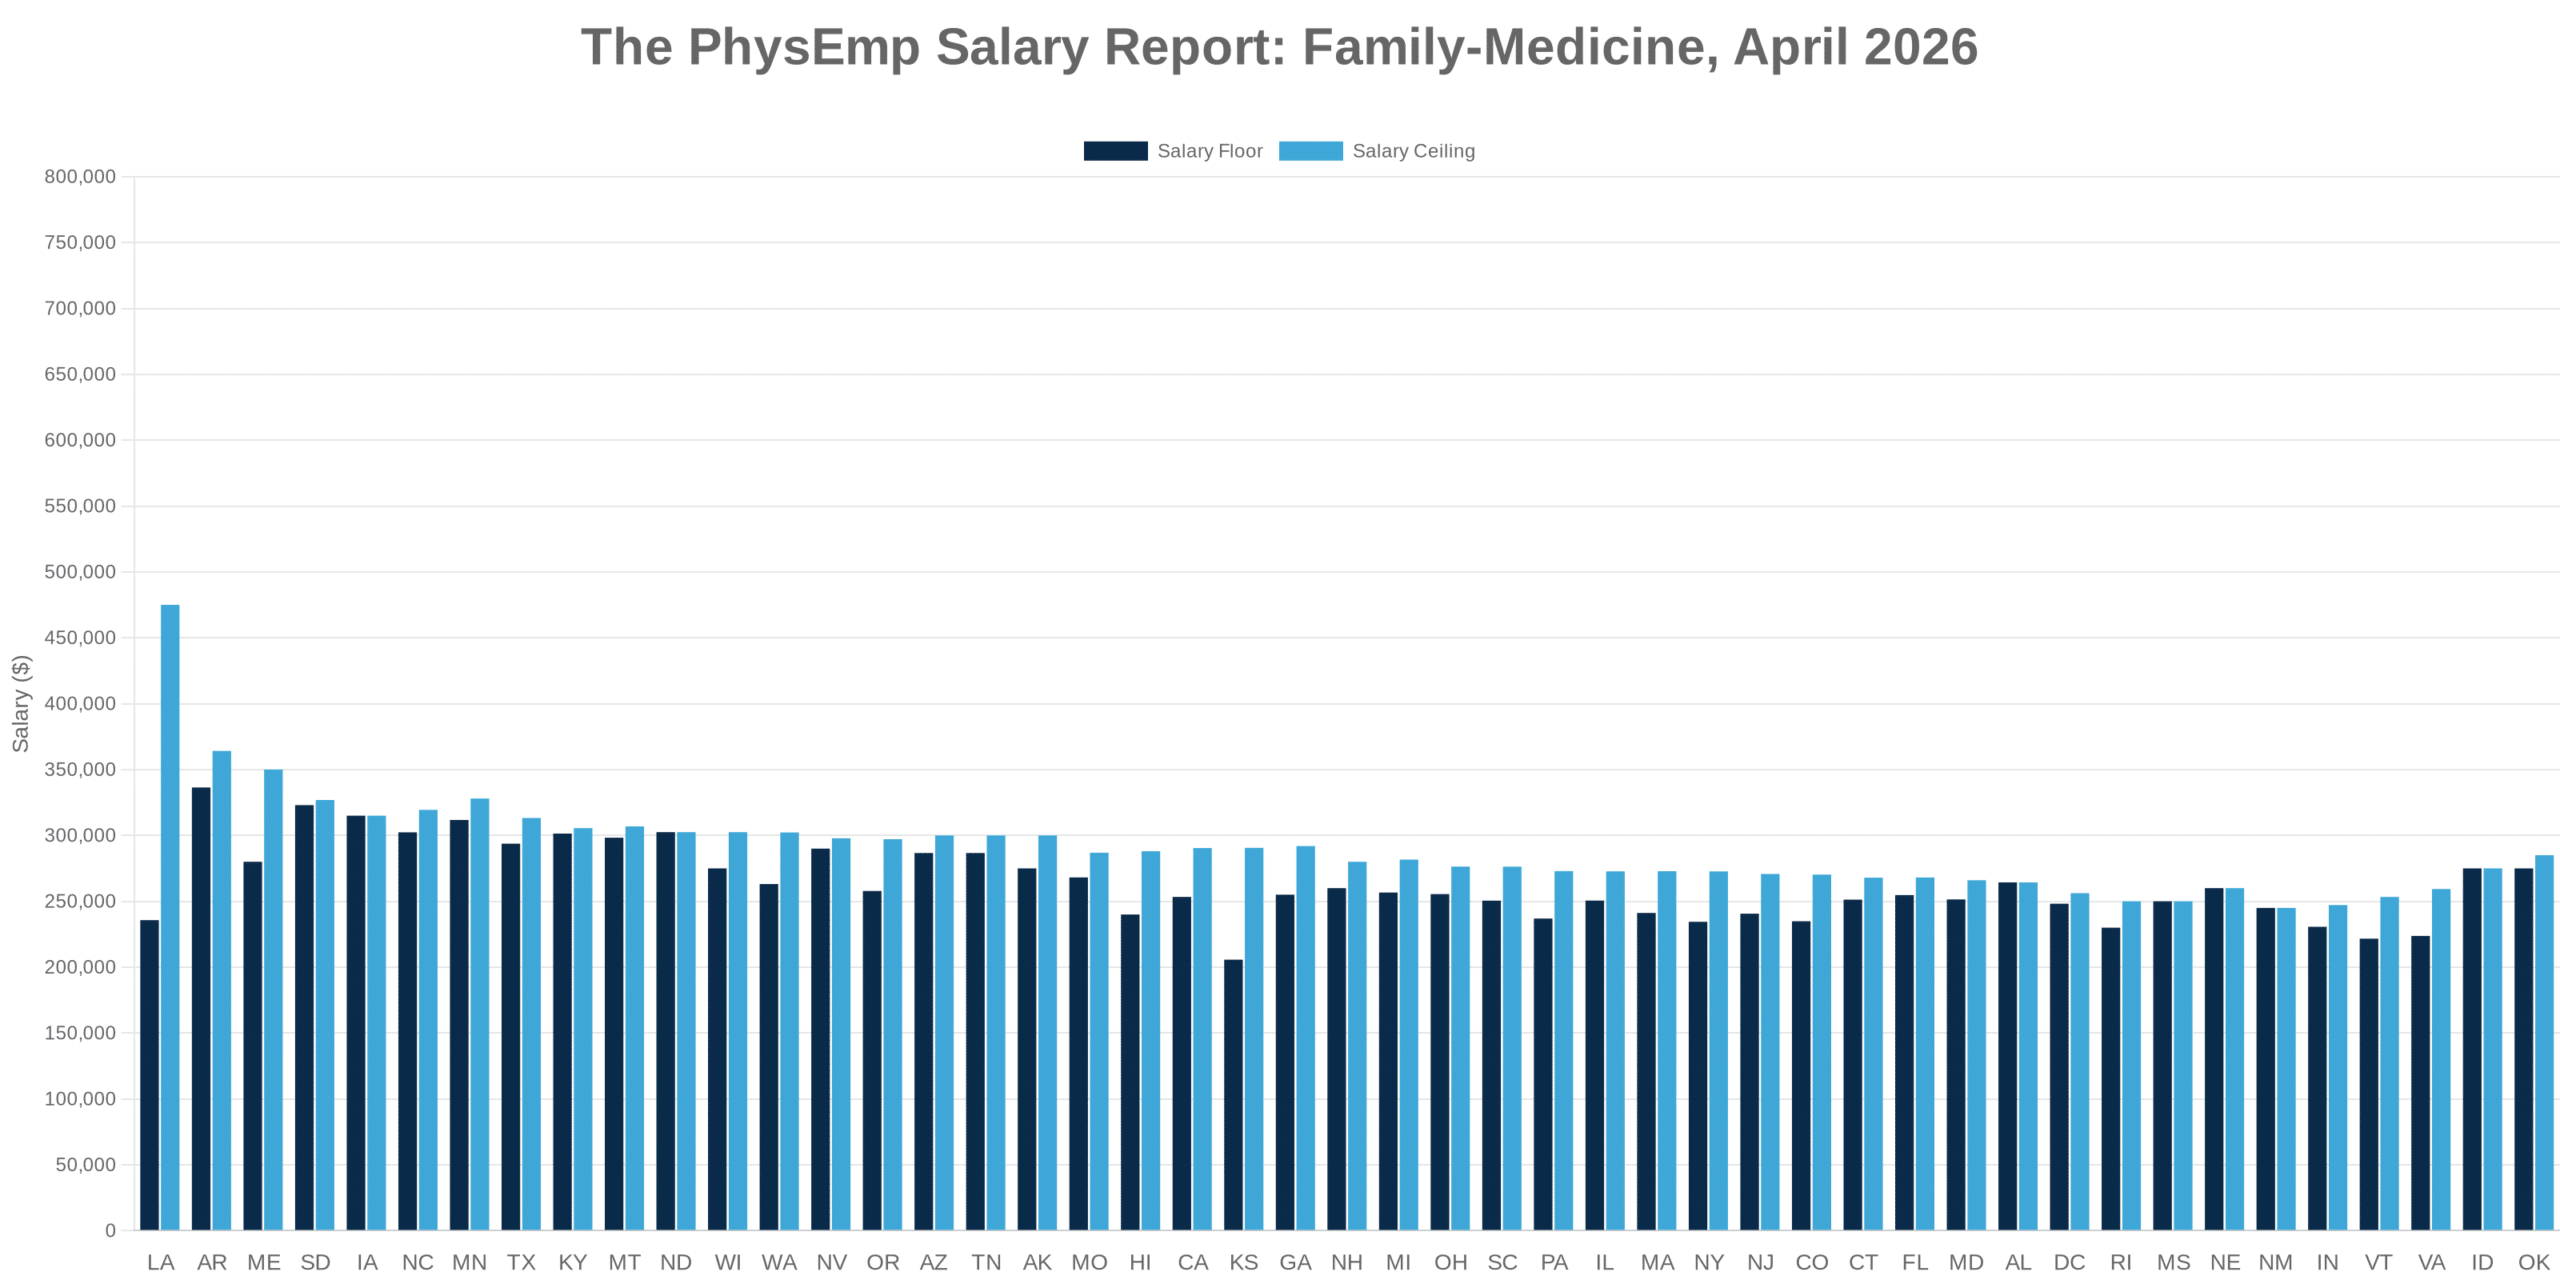
The Family Medicine Job Market at a Glance
Total listings: 2,955. Listings with salary data: 795. Full salary range: $110,000 to $800,000. Average salary range: $254,611 to $286,134.
The $690,000 spread between floor and ceiling is extraordinary, even accounting for part-time roles and outlier positions. Most credible full-time offers cluster between $200,000 and $320,000, but the long tail on both ends suggests a market shaped by geography, scope, and desperation (or lack thereof). The $800,000 ceiling likely reflects a high-need rural market willing to pay whatever it takes. The $110,000 floor may involve part-time work, academic settings, or a data entry error someone will regret.
Listings were identified in New York, California, Florida, Illinois, Pennsylvania, Texas, Georgia, North Carolina, Massachusetts, Connecticut, Nevada, Minnesota, South Carolina, North Dakota, Washington, Iowa, Virginia, Wisconsin, Indiana, Michigan, Hawaii, Maryland, New Jersey, Colorado, Missouri, Arizona, Ohio, Kentucky, Alabama, Louisiana, Vermont, Kansas, New Mexico, Oregon, South Dakota, Washington D.C., New Hampshire, Tennessee, Arkansas, Mississippi, Montana, Maine, Idaho, Delaware, Nebraska, Utah, Alaska, Oklahoma, West Virginia, Rhode Island, and Wyoming.
👉 Browse Family Medicine physician job opportunities
How States Stack Up
Overperformers
Arkansas leads the nation with an average range of $336,400 to $364,150 across 4 salary-reporting listings (small sample, big money). South Dakota averages $323,000 to $326,889 with 9 listings, proving the Northern Plains will pay for primary care. Iowa posts $315,000 flat on both ends with just 2 listings (take the offer). Minnesota delivers $311,750 to $328,000 across 65 listings, combining volume and premium pay. North Carolina averages $302,353 to $319,412 with 136 listings, making it the rare high-volume, high-pay state. Kentucky averages $301,415 to $305,538 across 11 listings. North Dakota posts $302,500 flat with 4 listings. Montana averages $298,286 to $306,857 with 7 listings.
Near-Average Performers
Texas averages $293,750 to $313,250 with 153 listings (volume leader with solid pay). Nevada averages $290,000 to $297,833 across 6 listings. California averages $253,311 to $290,426 with 422 listings (the volume king, but not the pay king). Oregon averages $257,857 to $297,143 with 7 listings. Missouri averages $268,125 to $286,875 across 8 listings. Arizona averages $286,667 to $300,000 with 3 listings. Tennessee averages $286,667 to $300,000 with 3 listings. Washington averages $263,110 to $302,274 across 17 listings. Alabama averages $264,375 flat with 8 listings. Ohio averages $255,474 to $276,368 with 19 listings. Georgia averages $255,042 to $291,947 across 117 listings. Florida averages $254,722 to $268,078 with 185 listings. Michigan averages $256,667 to $281,667 across 6 listings. Wisconsin averages $275,000 to $302,500 with 2 listings. Illinois averages $250,571 to $272,762 across 42 listings. South Carolina averages $250,526 to $276,316 with 19 listings. Connecticut averages $251,275 to $267,957 across 30 listings. Maryland averages $251,444 to $266,000 with 9 listings.
Underperformers
New York averages $234,450 to $272,711 across 113 listings (high volume, below-average pay). Massachusetts averages $241,157 to $272,871 with 35 listings. New Jersey averages $240,612 to $270,753 across 17 listings. Hawaii averages $240,000 to $288,000 with 5 listings. Pennsylvania averages $236,923 to $272,923 with 13 listings. Louisiana averages $235,714 to $475,000 across 7 listings (that high end is doing heavy lifting). Colorado averages $234,857 to $270,286 with 7 listings. New Mexico averages $245,000 flat with 2 listings. Rhode Island averages $230,000 to $250,000 with 1 listing. Indiana averages $230,667 to $247,167 across 15 listings. Virginia averages $223,744 to $259,327 with 11 listings. Vermont averages $221,667 to $253,333 across 6 listings. Kansas averages $205,714 to $290,571 with 7 listings (the national low-end leader).
Volume Leaders
California dominates with 422 listings but pays near the national average. New York follows with 197 listings and below-average compensation. Florida contributes 185 listings at benchmark pay. Texas posts 153 listings with above-average salaries. North Carolina offers 136 listings and premium compensation, a rare and valuable combination.
👉 Compare Family Medicine compensation and opportunities by region
What This Means If You’re a Physician
If your priority is maximum compensation: Target Arkansas, South Dakota, Iowa, Minnesota, or North Carolina. The single highest-paying listing identified is in Mattoon, Illinois, offering $315,000 to $350,000 annually (a smaller market, but the money is real). Arkansas posts the highest state average at $336,400 to $364,150, though listing volume is thin.
If your priority is maximum optionality: California offers 422 listings, New York 197, and Florida 185. Compensation in these states hovers near the national average, but the sheer volume means you can afford to be selective about practice setting, geography, and contract terms.
If your priority is balance: North Carolina, Texas, and Minnesota deliver both strong pay and meaningful job counts. North Carolina averages over $300,000 with 136 listings. Texas posts $293,750 to $313,250 across 153 opportunities. Minnesota offers $311,750 to $328,000 with 65 listings. All three provide leverage without requiring you to move to a town with one stoplight.
👉 Search Family Medicine jobs by location and compensation
What This Means If You’re a Recruiter
Salary transparency rate: 26.9% (795 listings with data divided by 2,955 total listings). That means nearly three-quarters of Family Medicine postings are asking candidates to apply blind. In a market this active, that is a strategic vulnerability.
The candidate pipeline implications are clear: physicians have options, and they will filter by compensation when they can. If your organization is in Kansas (average low $205,714), Virginia ($223,744), or Indiana ($230,667), you are competing against states offering $50,000 to $100,000 more on the low end alone. You will need to lead with lifestyle, loan repayment, partnership track, or geographic appeal, because the salary data will not close the deal.
High-volume states with below-average pay face the steepest climb. New York posts 197 listings but averages $234,450 to $272,711. California has 422 listings but pays $253,311 to $290,426. Both are under the national average low of $254,611. Recruiters in these markets should expect longer time-to-fill and more frequent late-stage declinations unless non-cash benefits are unusually strong.
👉 Post Family Medicine positions on PhysEmp
What’s Driving the Numbers
Rural scarcity commands a premium, and the data proves it.
Arkansas, South Dakota, Iowa, and Montana all post average salaries above $298,000, and none rank in the top ten for listing volume. These are not markets where employers can wait for the perfect candidate. They are markets where employers pay extra to ensure someone shows up. The inverse is also true: high-volume urban and suburban markets (California, New York, Florida) can afford to pay near the national average because the applicant pipeline is self-sustaining.
The volume-pay relationship is inverse, and that matters.
California has 422 listings and pays $253,311 to $290,426. North Carolina has 136 listings and pays $302,353 to $319,412. Texas has 153 listings and pays $293,750 to $313,250. The states with the most jobs are not the states with the most money, except when they are (see: Texas, North Carolina). Physicians who assume volume equals competition should reconsider. In Family Medicine, volume often equals saturation, and saturation suppresses wages.
Part-time roles and outliers distort both ends of the range.
The $110,000 floor and $800,000 ceiling are not representative of the full-time Family Medicine market. The former likely reflects part-time or academic work. The latter may involve a critical access hospital in a town with no other physician for 60 miles. The credible full-time range is $200,000 to $350,000, and most offers will fall between $240,000 and $310,000 depending on geography and scope.
Leadership and scope premiums are invisible in this dataset.
The raw data does not distinguish between outpatient-only roles, roles with OB, roles with hospital medicine, or roles with medical director responsibilities. But the $690,000 spread suggests these distinctions exist and matter. Physicians evaluating offers should ask what is included in the scope and whether the compensation reflects it. A $280,000 offer with no call is different from a $280,000 offer with OB and inpatient responsibilities.
The Bottom Line
The Family Medicine job market is a high-volume, high-variability environment where geography is destiny and compensation reflects desperation more than skill. Physicians have the leverage to be selective. Employers in low-paying, high-volume states will need to justify why someone should choose them over North Carolina, Texas, or Minnesota. And everyone should remember that $800,000 is an outlier, but $300,000 is increasingly the norm in states that need you more than you need them.
There is a lot of work available for physicians willing to treat the whole family. Choose your ZIP code carefully.
👉 Browse all Family Medicine physician jobs
👉 Upload your CV to get matched with opportunities
👉 Set alerts for new Family Medicine roles
Salary data based on 795 listings with disclosed compensation. Figures may reflect part-time or specialized roles. This report is informational and should not replace professional judgment or financial planning.


